Resource
| Id | Histone_ChIP-seq/ENCSR000DQM |
|---|---|
| Type | position_score |
| Version | 0 |
| Summary | Histone_ChIP-seq ENCSR000DQM [biosample_summary="Homo sapiens Caco-2" and target="H3K4me3"] |
| Description |
status: released biological_replicates: Rep 1, Rep 2 summary: output_type: replicated peaks audit_internal_action: Archived analysis {ENCAN478IKG|/analyses/ENCAN478IKG/} has in progress subobject quality standard {encode3-histone-chip|/quality-standards/encode3-histone-chip/} audit_warning: Processed alignments file {ENCFF448CAQ|/files/ENCFF448CAQ/} processed by ChIP-seq ENCODE3 GRCh38 pipeline has 11036240 usable fragments. The minimum ENCODE standard for each replicate in a ChIP-seq experiment targeting H3K4me3-human and investigated as a narrow histone mark is 10 million usable fragments. The recommended value is > 20 million, but > 10 million is acceptable. (See {ENCODE ChIP-seq data standards|/data-standards/chip-seq/}) audit_warning: Processed alignments file {ENCFF069VSC|/files/ENCFF069VSC/} processed by ChIP-seq ENCODE3 GRCh38 pipeline has 11447300 usable fragments. The minimum ENCODE standard for each replicate in a ChIP-seq experiment targeting H3K4me3-human and investigated as a narrow histone mark is 10 million usable fragments. The recommended value is > 20 million, but > 10 million is acceptable. (See {ENCODE ChIP-seq data standards|/data-standards/chip-seq/}) audit_warning: PBC1 (PCR Bottlenecking Coefficient 1, M1/M_distinct) is the ratio of the number of genomic locations where exactly one read maps uniquely (M1) to the number of genomic locations where some reads map (M_distinct). A PBC1 value in the range 0 - 0.5 is severe bottlenecking, 0.5 - 0.8 is moderate bottlenecking, 0.8 - 0.9 is mild bottlenecking, and > 0.9 is no bottlenecking. PBC1 value > 0.9 is recommended, but > 0.8 is acceptable. ENCODE processed alignments file {ENCFF448CAQ|/files/ENCFF448CAQ/} processed by ChIP-seq ENCODE3 GRCh38 pipeline was generated from a library with PBC1 value of 0.88. audit_warning: PBC2 (PCR Bottlenecking Coefficient 2, M1/M2) is the ratio of the number of genomic locations where exactly one read maps uniquely (M1) to the number of genomic locations where two reads map uniquely (M2). A PBC2 value in the range 0 - 1 is severe bottlenecking, 1 - 3 is moderate bottlenecking, 3 - 10 is mild bottlenecking, > 10 is no bottlenecking. PBC2 value > 10 is recommended, but > 3 is acceptable. ENCODE processed alignments file {ENCFF448CAQ|/files/ENCFF448CAQ/} processed by ChIP-seq ENCODE3 GRCh38 pipeline was generated from a library with PBC2 value of 8.59. audit_warning: PBC1 (PCR Bottlenecking Coefficient 1, M1/M_distinct) is the ratio of the number of genomic locations where exactly one read maps uniquely (M1) to the number of genomic locations where some reads map (M_distinct). A PBC1 value in the range 0 - 0.5 is severe bottlenecking, 0.5 - 0.8 is moderate bottlenecking, 0.8 - 0.9 is mild bottlenecking, and > 0.9 is no bottlenecking. PBC1 value > 0.9 is recommended, but > 0.8 is acceptable. ENCODE processed alignments file {ENCFF069VSC|/files/ENCFF069VSC/} processed by ChIP-seq ENCODE3 GRCh38 pipeline was generated from a library with PBC1 value of 0.89. audit_warning: PBC2 (PCR Bottlenecking Coefficient 2, M1/M2) is the ratio of the number of genomic locations where exactly one read maps uniquely (M1) to the number of genomic locations where two reads map uniquely (M2). A PBC2 value in the range 0 - 1 is severe bottlenecking, 1 - 3 is moderate bottlenecking, 3 - 10 is mild bottlenecking, > 10 is no bottlenecking. PBC2 value > 10 is recommended, but > 3 is acceptable. ENCODE processed alignments file {ENCFF069VSC|/files/ENCFF069VSC/} processed by ChIP-seq ENCODE3 GRCh38 pipeline was generated from a library with PBC2 value of 9.29. |
| Labels |
|
Scores (1)
| ID | Type | Default annotation | Description | Histogram | Range | Summary |
|---|---|---|---|---|---|---|
| Histone_ChIP-seq_ENCSR000DQM | float |
Histone_ChIP-seq_ENCSR000DQM |
Histone_ChIP-seq ENCSR000DQM [biosample_summary="Homo sapiens Caco-2" and target="H3K4me3"]
|
 |
[1.95, 114] |
|
n counts base pairs; sd is the population standard deviation.
Coverage
| Chromosome | Covered positions | Covered % | Segments |
|---|---|---|---|
| all chromosomes | 32766961 | 1.02% | 27172 |
| chr1 | 3160119 | 1.27% | 2701 |
| chr1_KI270712v1_random | 1095 | 0.62% | 3 |
| chr1_KI270713v1_random | 645 | 1.58% | 4 |
| chr2 | 2252321 | 0.93% | 1818 |
| chr3 | 1831487 | 0.92% | 1484 |
| chr4 | 1289054 | 0.68% | 1045 |
| chr5 | 1481552 | 0.82% | 1146 |
| chr6 | 1918438 | 1.12% | 1492 |
| chr7 | 1600298 | 1.00% | 1350 |
| chr8 | 1155462 | 0.80% | 943 |
| chr9 | 1295166 | 0.94% | 1111 |
| chr10 | 1471606 | 1.10% | 1161 |
| chr11 | 1836090 | 1.36% | 1399 |
| chr12 | 1762134 | 1.32% | 1384 |
| chr13 | 673929 | 0.59% | 526 |
| chr14 | 1105389 | 1.03% | 904 |
| chr14_GL000194v1_random | 274 | 0.14% | 1 |
| chr15 | 1022773 | 1.00% | 853 |
| chr16 | 1344356 | 1.49% | 1165 |
| chr17 | 1970777 | 2.37% | 1637 |
| chr17_GL000205v2_random | 2380 | 1.28% | 3 |
| chr18 | 505526 | 0.63% | 466 |
| chr19 | 2113764 | 3.61% | 1958 |
| chr20 | 923294 | 1.43% | 734 |
| chr21 | 306630 | 0.66% | 288 |
| chr22 | 728162 | 1.43% | 657 |
| chr22_KI270733v1_random | 158 | 0.09% | 1 |
| chrUn_GL000195v1 | 715 | 0.39% | 3 |
| chrUn_GL000219v1 | 1465 | 0.82% | 2 |
| chrUn_GL000220v1 | 416 | 0.26% | 2 |
| chrX | 1011486 | 0.65% | 931 |
| 3335 contigs with no values (185006984 bp) | 0 | 0.00% | 0 |
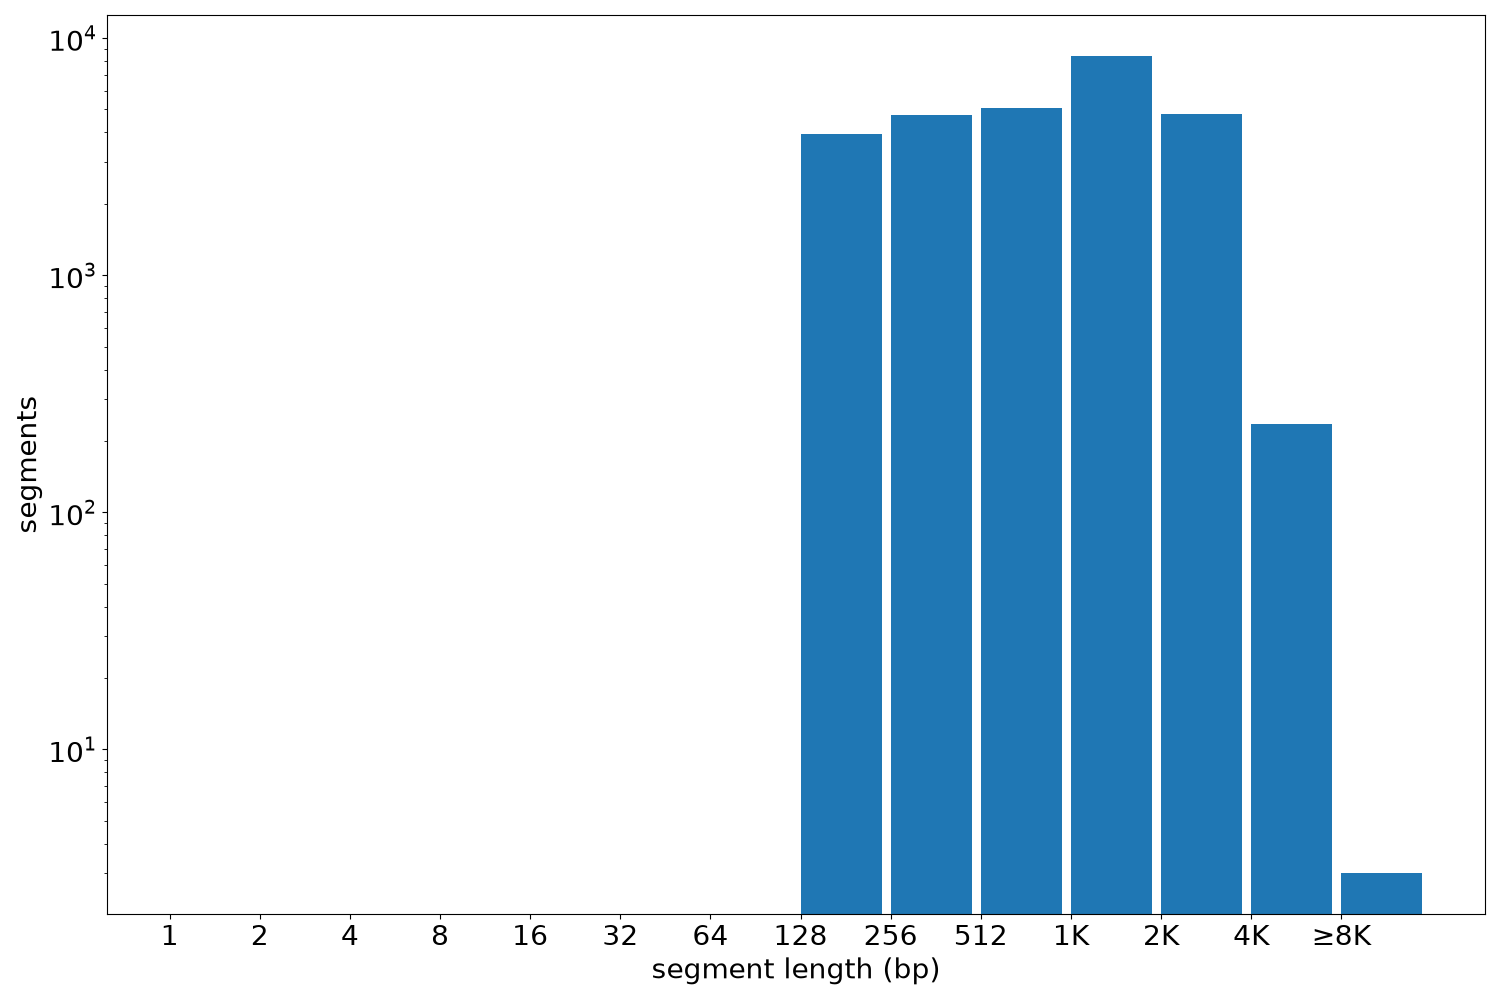
Segment lengths
| segments | min | max | mean | median | |
|---|---|---|---|---|---|
| segments | 27172 | 150 | 10278 | 1205.91 | 1006 |
Files
| Filename | Size | md5 |
|---|---|---|
| ENCFF434CLI.bed.gz | 737.25 KB | 89edb9db5a7c2bdc6473ed0dc62b13c1 |
| ENCFF434CLI.tabix.bed.gz | 313.24 KB | 158ada4e7ace70861b9b77d19123e7b4 |
| ENCFF434CLI.tabix.bed.gz.tbi | 144.38 KB | 1c81b0b8e7c451ee4d4474f1b06ab4db |
| genomic_resource.yaml | 5.26 KB | ae7460cd59d965ecfb494551fff74c6e |
| statistics/ |