Resource
| Id | Histone_ChIP-seq/ENCSR000DQH |
|---|---|
| Type | position_score |
| Version | 0 |
| Summary | Histone_ChIP-seq ENCSR000DQH [biosample_summary="Homo sapiens BJ" and target="H3K4me3"] |
| Description |
status: released biological_replicates: Rep 1, Rep 2 summary: output_type: replicated peaks audit_internal_action: Archived analysis {ENCAN854KIB|/analyses/ENCAN854KIB/} has in progress subobject quality standard {encode3-histone-chip|/quality-standards/encode3-histone-chip/} audit_warning: Processed alignments file {ENCFF322CYX|/files/ENCFF322CYX/} processed by ChIP-seq ENCODE3 GRCh38 pipeline has 12776436 usable fragments. The minimum ENCODE standard for each replicate in a ChIP-seq experiment targeting H3K4me3-human and investigated as a narrow histone mark is 10 million usable fragments. The recommended value is > 20 million, but > 10 million is acceptable. (See {ENCODE ChIP-seq data standards|/data-standards/chip-seq/}) audit_warning: Processed alignments file {ENCFF311CVR|/files/ENCFF311CVR/} processed by ChIP-seq ENCODE3 GRCh38 pipeline has 10192374 usable fragments. The minimum ENCODE standard for each replicate in a ChIP-seq experiment targeting H3K4me3-human and investigated as a narrow histone mark is 10 million usable fragments. The recommended value is > 20 million, but > 10 million is acceptable. (See {ENCODE ChIP-seq data standards|/data-standards/chip-seq/}) audit_warning: PBC1 (PCR Bottlenecking Coefficient 1, M1/M_distinct) is the ratio of the number of genomic locations where exactly one read maps uniquely (M1) to the number of genomic locations where some reads map (M_distinct). A PBC1 value in the range 0 - 0.5 is severe bottlenecking, 0.5 - 0.8 is moderate bottlenecking, 0.8 - 0.9 is mild bottlenecking, and > 0.9 is no bottlenecking. PBC1 value > 0.9 is recommended, but > 0.8 is acceptable. ENCODE processed alignments file {ENCFF322CYX|/files/ENCFF322CYX/} processed by ChIP-seq ENCODE3 GRCh38 pipeline was generated from a library with PBC1 value of 0.86. audit_warning: PBC2 (PCR Bottlenecking Coefficient 2, M1/M2) is the ratio of the number of genomic locations where exactly one read maps uniquely (M1) to the number of genomic locations where two reads map uniquely (M2). A PBC2 value in the range 0 - 1 is severe bottlenecking, 1 - 3 is moderate bottlenecking, 3 - 10 is mild bottlenecking, > 10 is no bottlenecking. PBC2 value > 10 is recommended, but > 3 is acceptable. ENCODE processed alignments file {ENCFF322CYX|/files/ENCFF322CYX/} processed by ChIP-seq ENCODE3 GRCh38 pipeline was generated from a library with PBC2 value of 7.33. audit_warning: PBC1 (PCR Bottlenecking Coefficient 1, M1/M_distinct) is the ratio of the number of genomic locations where exactly one read maps uniquely (M1) to the number of genomic locations where some reads map (M_distinct). A PBC1 value in the range 0 - 0.5 is severe bottlenecking, 0.5 - 0.8 is moderate bottlenecking, 0.8 - 0.9 is mild bottlenecking, and > 0.9 is no bottlenecking. PBC1 value > 0.9 is recommended, but > 0.8 is acceptable. ENCODE processed alignments file {ENCFF311CVR|/files/ENCFF311CVR/} processed by ChIP-seq ENCODE3 GRCh38 pipeline was generated from a library with PBC1 value of 0.89. audit_warning: PBC2 (PCR Bottlenecking Coefficient 2, M1/M2) is the ratio of the number of genomic locations where exactly one read maps uniquely (M1) to the number of genomic locations where two reads map uniquely (M2). A PBC2 value in the range 0 - 1 is severe bottlenecking, 1 - 3 is moderate bottlenecking, 3 - 10 is mild bottlenecking, > 10 is no bottlenecking. PBC2 value > 10 is recommended, but > 3 is acceptable. ENCODE processed alignments file {ENCFF311CVR|/files/ENCFF311CVR/} processed by ChIP-seq ENCODE3 GRCh38 pipeline was generated from a library with PBC2 value of 9.72. |
| Labels |
|
Scores (1)
| ID | Type | Default annotation | Description | Histogram | Range | Summary |
|---|---|---|---|---|---|---|
| Histone_ChIP-seq_ENCSR000DQH | float |
Histone_ChIP-seq_ENCSR000DQH |
Histone_ChIP-seq ENCSR000DQH [biosample_summary="Homo sapiens BJ" and target="H3K4me3"]
|
 |
[1.86, 143] |
|
n counts base pairs; sd is the population standard deviation.
Coverage
| Chromosome | Covered positions | Covered % | Segments |
|---|---|---|---|
| all chromosomes | 32589510 | 1.01% | 26499 |
| chr1 | 3177089 | 1.28% | 2578 |
| chr1_KI270712v1_random | 834 | 0.47% | 2 |
| chr1_KI270713v1_random | 284 | 0.70% | 1 |
| chr1_KI270714v1_random | 277 | 0.66% | 1 |
| chr2 | 2228759 | 0.92% | 1782 |
| chr3 | 1837915 | 0.93% | 1434 |
| chr4 | 1301528 | 0.68% | 1016 |
| chr5 | 1547658 | 0.85% | 1208 |
| chr6 | 1938540 | 1.13% | 1569 |
| chr7 | 1549536 | 0.97% | 1282 |
| chr8 | 1225782 | 0.84% | 969 |
| chr9 | 1343077 | 0.97% | 1118 |
| chr10 | 1354573 | 1.01% | 1083 |
| chr11 | 1769279 | 1.31% | 1358 |
| chr12 | 1788420 | 1.34% | 1377 |
| chr13 | 661349 | 0.58% | 545 |
| chr14 | 1041727 | 0.97% | 826 |
| chr14_GL000194v1_random | 160 | 0.08% | 1 |
| chr15 | 1065463 | 1.04% | 861 |
| chr16 | 1282452 | 1.42% | 1098 |
| chr17 | 1858633 | 2.23% | 1554 |
| chr17_GL000205v2_random | 2081 | 1.12% | 2 |
| chr18 | 550820 | 0.69% | 466 |
| chr19 | 2122502 | 3.62% | 1876 |
| chr20 | 820263 | 1.27% | 699 |
| chr21 | 296521 | 0.63% | 251 |
| chr22 | 718648 | 1.41% | 625 |
| chr22_KI270733v1_random | 276 | 0.15% | 1 |
| chrUn_GL000195v1 | 226 | 0.12% | 1 |
| chrUn_GL000218v1 | 269 | 0.17% | 1 |
| chrUn_GL000219v1 | 3596 | 2.01% | 3 |
| chrUn_GL000220v1 | 287 | 0.18% | 1 |
| chrX | 1060150 | 0.68% | 882 |
| chrY | 40536 | 0.07% | 28 |
| 3332 contigs with no values (127576705 bp) | 0 | 0.00% | 0 |
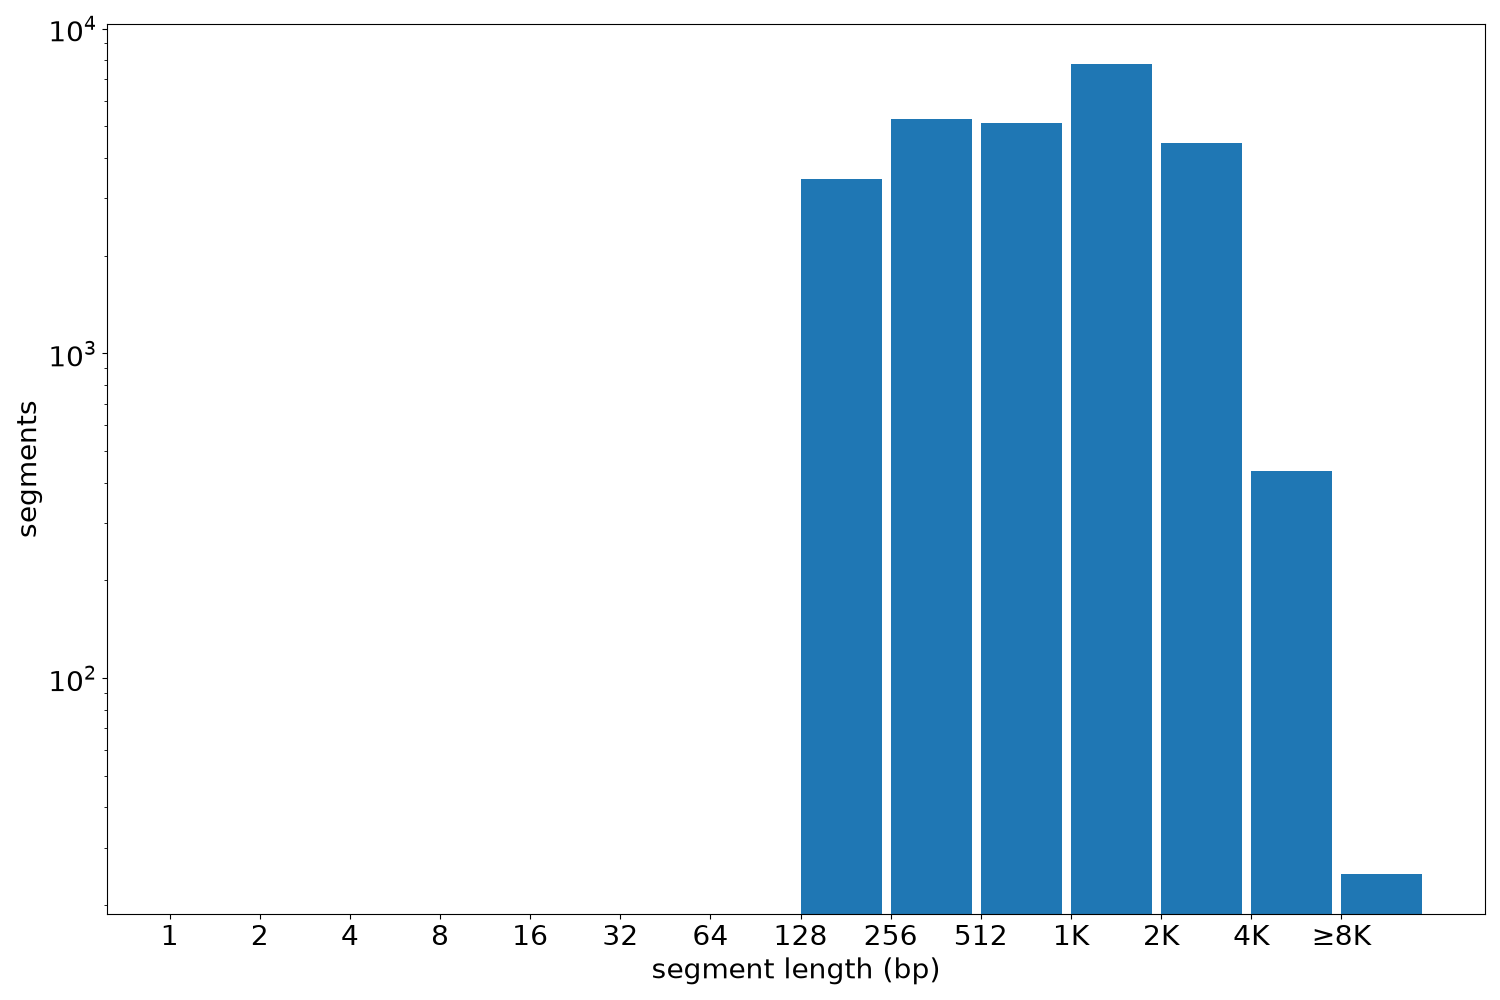
Segment lengths
| segments | min | max | mean | median | |
|---|---|---|---|---|---|
| segments | 26499 | 155 | 20437 | 1229.84 | 952 |
Files
| Filename | Size | md5 |
|---|---|---|
| ENCFF224GRF.bed.gz | 721.97 KB | 3ad908f9e79b4a6bd269af8c9a00f45d |
| ENCFF224GRF.tabix.bed.gz | 307.23 KB | 166c26d4a69ca7117ae3d53573c27da7 |
| ENCFF224GRF.tabix.bed.gz.tbi | 149.61 KB | 9aab618f55656e0237fa271058975dd5 |
| genomic_resource.yaml | 4.95 KB | 12f2df98400c0fcb50a9c942aafbadc7 |
| statistics/ |