Resource
| Id | Histone_ChIP-seq/ENCSR000DPX |
|---|---|
| Type | position_score |
| Version | 0 |
| Summary | Histone_ChIP-seq ENCSR000DPX [biosample_summary="Homo sapiens AG10803" and target="H3K4me3"] |
| Description |
status: released biological_replicates: Rep 1, Rep 2 summary: output_type: replicated peaks audit_internal_action: Archived analysis {ENCAN316SIT|/analyses/ENCAN316SIT/} has in progress subobject quality standard {encode3-histone-chip|/quality-standards/encode3-histone-chip/} audit_warning: PBC1 (PCR Bottlenecking Coefficient 1, M1/M_distinct) is the ratio of the number of genomic locations where exactly one read maps uniquely (M1) to the number of genomic locations where some reads map (M_distinct). A PBC1 value in the range 0 - 0.5 is severe bottlenecking, 0.5 - 0.8 is moderate bottlenecking, 0.8 - 0.9 is mild bottlenecking, and > 0.9 is no bottlenecking. PBC1 value > 0.9 is recommended, but > 0.8 is acceptable. ENCODE processed alignments file {ENCFF270HAZ|/files/ENCFF270HAZ/} processed by ChIP-seq ENCODE3 hg19 pipeline was generated from a library with PBC1 value of 0.84. audit_warning: PBC2 (PCR Bottlenecking Coefficient 2, M1/M2) is the ratio of the number of genomic locations where exactly one read maps uniquely (M1) to the number of genomic locations where two reads map uniquely (M2). A PBC2 value in the range 0 - 1 is severe bottlenecking, 1 - 3 is moderate bottlenecking, 3 - 10 is mild bottlenecking, > 10 is no bottlenecking. PBC2 value > 10 is recommended, but > 3 is acceptable. ENCODE processed alignments file {ENCFF270HAZ|/files/ENCFF270HAZ/} processed by ChIP-seq ENCODE3 hg19 pipeline was generated from a library with PBC2 value of 6.86. audit_warning: PBC1 (PCR Bottlenecking Coefficient 1, M1/M_distinct) is the ratio of the number of genomic locations where exactly one read maps uniquely (M1) to the number of genomic locations where some reads map (M_distinct). A PBC1 value in the range 0 - 0.5 is severe bottlenecking, 0.5 - 0.8 is moderate bottlenecking, 0.8 - 0.9 is mild bottlenecking, and > 0.9 is no bottlenecking. PBC1 value > 0.9 is recommended, but > 0.8 is acceptable. ENCODE processed alignments file {ENCFF044VLF|/files/ENCFF044VLF/} processed by ChIP-seq ENCODE3 hg19 pipeline was generated from a library with PBC1 value of 0.84. audit_warning: PBC2 (PCR Bottlenecking Coefficient 2, M1/M2) is the ratio of the number of genomic locations where exactly one read maps uniquely (M1) to the number of genomic locations where two reads map uniquely (M2). A PBC2 value in the range 0 - 1 is severe bottlenecking, 1 - 3 is moderate bottlenecking, 3 - 10 is mild bottlenecking, > 10 is no bottlenecking. PBC2 value > 10 is recommended, but > 3 is acceptable. ENCODE processed alignments file {ENCFF044VLF|/files/ENCFF044VLF/} processed by ChIP-seq ENCODE3 hg19 pipeline was generated from a library with PBC2 value of 7.12. |
| Labels |
|
Scores (1)
| ID | Type | Default annotation | Description | Histogram | Range | Summary |
|---|---|---|---|---|---|---|
| Histone_ChIP-seq_ENCSR000DPX | float |
Histone_ChIP-seq_ENCSR000DPX |
Histone_ChIP-seq ENCSR000DPX [biosample_summary="Homo sapiens AG10803" and target="H3K4me3"]
|
 |
[1.91, 108] |
|
n counts base pairs; sd is the population standard deviation.
Coverage
| Chromosome | Covered positions | Covered % | Segments |
|---|---|---|---|
| all chromosomes | 39559581 | 1.23% | 41287 |
| chr1 | 3860908 | 1.55% | 3973 |
| chr2 | 2779096 | 1.15% | 2952 |
| chr3 | 2270690 | 1.15% | 2227 |
| chr4 | 1579774 | 0.83% | 1594 |
| chr5 | 1933786 | 1.07% | 1980 |
| chr6 | 2376147 | 1.39% | 2340 |
| chr7 | 1877005 | 1.18% | 2013 |
| chr8 | 1532904 | 1.06% | 1619 |
| chr9 | 1623877 | 1.17% | 1771 |
| chr10 | 1703826 | 1.27% | 1821 |
| chr11 | 2140037 | 1.58% | 2140 |
| chr12 | 2178845 | 1.63% | 2138 |
| chr13 | 840151 | 0.73% | 929 |
| chr14 | 1262763 | 1.18% | 1257 |
| chr15 | 1316317 | 1.29% | 1385 |
| chr16 | 1514008 | 1.68% | 1661 |
| chr17 | 2257574 | 2.71% | 2413 |
| chr18 | 696191 | 0.87% | 795 |
| chr19 | 2375986 | 4.05% | 2530 |
| chr20 | 982467 | 1.52% | 1076 |
| chr21 | 410436 | 0.88% | 464 |
| chr22 | 864593 | 1.70% | 959 |
| chrX | 1137068 | 0.73% | 1210 |
| chrY | 45132 | 0.08% | 40 |
| 3342 contigs with no values (129077085 bp) | 0 | 0.00% | 0 |
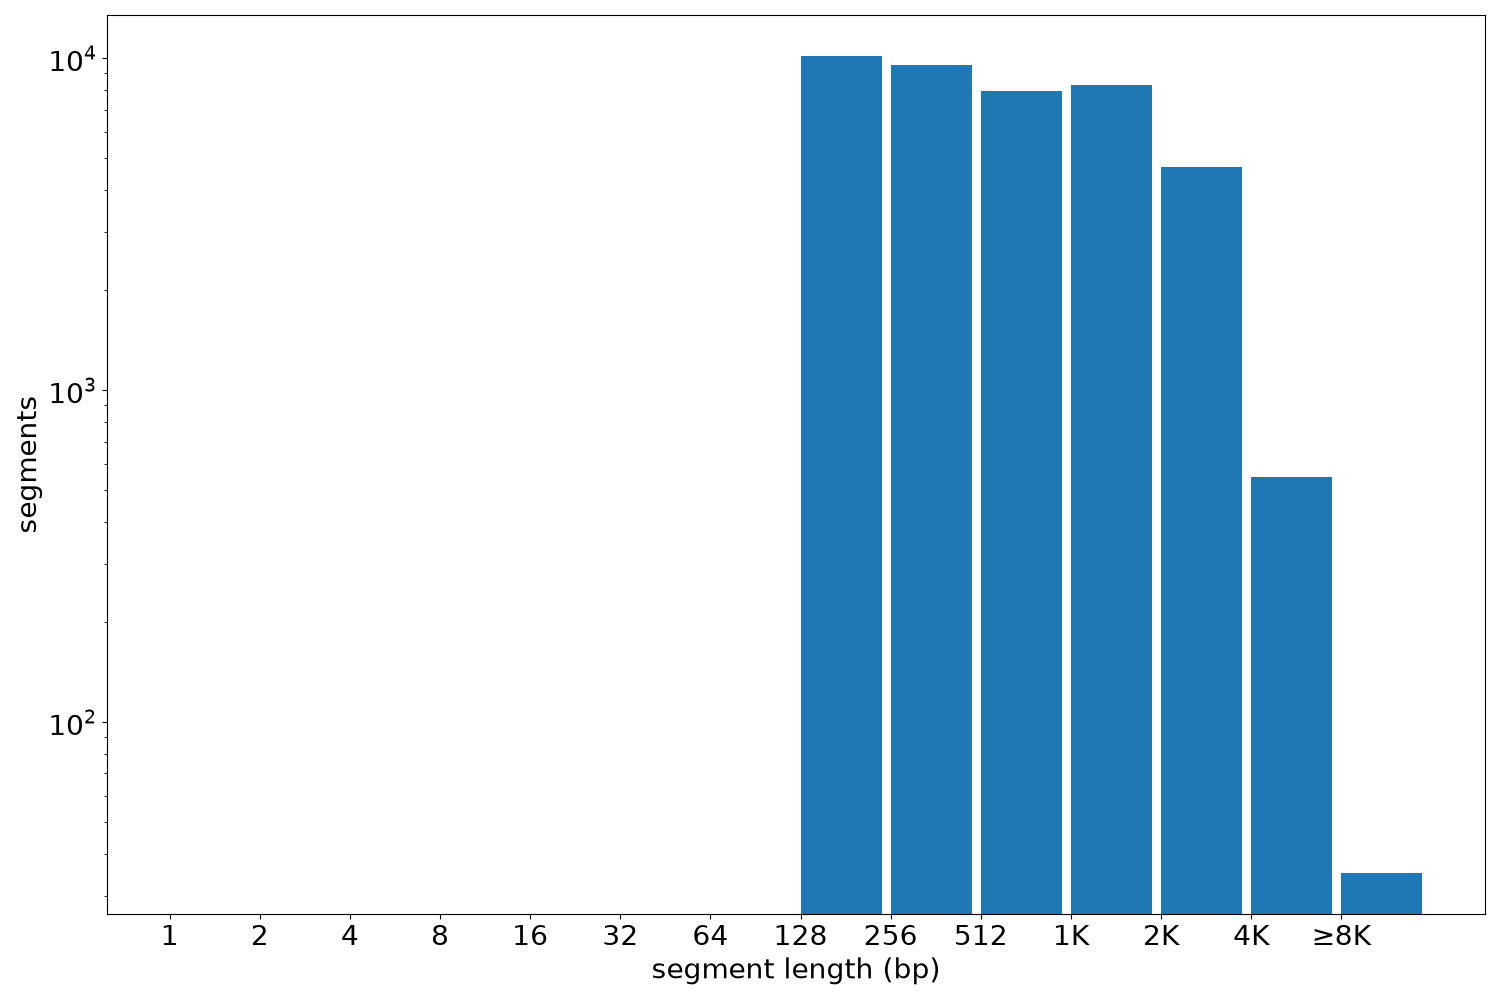
Segment lengths
| segments | min | max | mean | median | |
|---|---|---|---|---|---|
| segments | 41287 | 130 | 46878 | 958.16 | 552 |
Files
| Filename | Size | md5 |
|---|---|---|
| ENCFF650SIN.bed.gz | 992.29 KB | 0f123d0f8102807a1bcda905f75d38fc |
| ENCFF650SIN.tabix.bed.gz | 450.49 KB | fd22d8af7761499fcd6a48a9b27b9183 |
| ENCFF650SIN.tabix.bed.gz.tbi | 188.67 KB | 9077855bb8377086961e3a19d94469ea |
| genomic_resource.yaml | 4.26 KB | 0e5c5208ed900fea627de7c57a25dc4e |
| statistics/ |