Resource
| Id | Histone_ChIP-seq/ENCSR000DPO |
|---|---|
| Type | position_score |
| Version | 0 |
| Summary | Histone_ChIP-seq ENCSR000DPO [biosample_summary="Homo sapiens AG04450" and target="H3K4me3"] |
| Description |
status: released biological_replicates: Rep 1, Rep 2 summary: output_type: pseudoreplicated peaks audit_internal_action: Released analysis {ENCAN124NBL|/analyses/ENCAN124NBL/} has in progress subobject document {d876c034-798b-4449-9c1a-674cef49c8f5|/documents/d876c034-798b-4449-9c1a-674cef49c8f5/} audit_internal_action: Released analysis {ENCAN124NBL|/analyses/ENCAN124NBL/} has in progress subobject quality standard {encode4-histone-chip|/quality-standards/encode4-histone-chip/} audit_warning: Processed alignments file {ENCFF860NRT|/files/ENCFF860NRT/} processed by ChIP-seq ENCODE4 v1.5.1 GRCh38 pipeline has 19982147 usable fragments. The minimum ENCODE standard for each replicate in a ChIP-seq experiment targeting H3K4me3-human and investigated as a narrow histone mark is 10 million usable fragments. The recommended value is > 20 million, but > 10 million is acceptable. (See {ENCODE ChIP-seq data standards|/data-standards/chip-seq/}) audit_warning: Processed alignments file {ENCFF578IJM|/files/ENCFF578IJM/} processed by ChIP-seq ENCODE4 v1.5.1 GRCh38 pipeline has 19723704 usable fragments. The minimum ENCODE standard for each replicate in a ChIP-seq experiment targeting H3K4me3-human and investigated as a narrow histone mark is 10 million usable fragments. The recommended value is > 20 million, but > 10 million is acceptable. (See {ENCODE ChIP-seq data standards|/data-standards/chip-seq/}) audit_warning: PBC1 (PCR Bottlenecking Coefficient 1, M1/M_distinct) is the ratio of the number of genomic locations where exactly one read maps uniquely (M1) to the number of genomic locations where some reads map (M_distinct). A PBC1 value in the range 0 - 0.5 is severe bottlenecking, 0.5 - 0.8 is moderate bottlenecking, 0.8 - 0.9 is mild bottlenecking, and > 0.9 is no bottlenecking. PBC1 value > 0.9 is recommended, but > 0.8 is acceptable. ENCODE processed alignments file {ENCFF860NRT|/files/ENCFF860NRT/} processed by ChIP-seq ENCODE4 v1.5.1 GRCh38 pipeline was generated from a library with PBC1 value of 0.82. audit_warning: PBC2 (PCR Bottlenecking Coefficient 2, M1/M2) is the ratio of the number of genomic locations where exactly one read maps uniquely (M1) to the number of genomic locations where two reads map uniquely (M2). A PBC2 value in the range 0 - 1 is severe bottlenecking, 1 - 3 is moderate bottlenecking, 3 - 10 is mild bottlenecking, > 10 is no bottlenecking. PBC2 value > 10 is recommended, but > 3 is acceptable. ENCODE processed alignments file {ENCFF860NRT|/files/ENCFF860NRT/} processed by ChIP-seq ENCODE4 v1.5.1 GRCh38 pipeline was generated from a library with PBC2 value of 6.46. audit_warning: PBC1 (PCR Bottlenecking Coefficient 1, M1/M_distinct) is the ratio of the number of genomic locations where exactly one read maps uniquely (M1) to the number of genomic locations where some reads map (M_distinct). A PBC1 value in the range 0 - 0.5 is severe bottlenecking, 0.5 - 0.8 is moderate bottlenecking, 0.8 - 0.9 is mild bottlenecking, and > 0.9 is no bottlenecking. PBC1 value > 0.9 is recommended, but > 0.8 is acceptable. ENCODE processed alignments file {ENCFF578IJM|/files/ENCFF578IJM/} processed by ChIP-seq ENCODE4 v1.5.1 GRCh38 pipeline was generated from a library with PBC1 value of 0.83. audit_warning: PBC2 (PCR Bottlenecking Coefficient 2, M1/M2) is the ratio of the number of genomic locations where exactly one read maps uniquely (M1) to the number of genomic locations where two reads map uniquely (M2). A PBC2 value in the range 0 - 1 is severe bottlenecking, 1 - 3 is moderate bottlenecking, 3 - 10 is mild bottlenecking, > 10 is no bottlenecking. PBC2 value > 10 is recommended, but > 3 is acceptable. ENCODE processed alignments file {ENCFF578IJM|/files/ENCFF578IJM/} processed by ChIP-seq ENCODE4 v1.5.1 GRCh38 pipeline was generated from a library with PBC2 value of 6.56. |
| Labels |
|
Scores (1)
| ID | Type | Default annotation | Description | Histogram | Range | Summary |
|---|---|---|---|---|---|---|
| Histone_ChIP-seq_ENCSR000DPO | float |
Histone_ChIP-seq_ENCSR000DPO |
Histone_ChIP-seq ENCSR000DPO [biosample_summary="Homo sapiens AG04450" and target="H3K4me3"]
|
 |
[2.02, 107] |
|
n counts base pairs; sd is the population standard deviation.
Coverage
| Chromosome | Covered positions | Covered % | Segments |
|---|---|---|---|
| all chromosomes | 38868803 | 1.21% | 37041 |
| chr1 | 3838495 | 1.54% | 3764 |
| chr2 | 2665748 | 1.10% | 2593 |
| chr3 | 2210580 | 1.11% | 1988 |
| chr4 | 1577208 | 0.83% | 1472 |
| chr5 | 1884414 | 1.04% | 1691 |
| chr6 | 2290197 | 1.34% | 2107 |
| chr7 | 1882918 | 1.18% | 1823 |
| chr8 | 1467795 | 1.01% | 1415 |
| chr9 | 1604287 | 1.16% | 1563 |
| chr10 | 1626422 | 1.22% | 1583 |
| chr11 | 2134556 | 1.58% | 1924 |
| chr12 | 2102710 | 1.58% | 1884 |
| chr13 | 776408 | 0.68% | 805 |
| chr14 | 1248083 | 1.17% | 1122 |
| chr15 | 1309139 | 1.28% | 1242 |
| chr16 | 1536778 | 1.70% | 1510 |
| chr17 | 2292960 | 2.75% | 2191 |
| chr18 | 629278 | 0.78% | 639 |
| chr19 | 2398640 | 4.09% | 2373 |
| chr20 | 979820 | 1.52% | 958 |
| chr21 | 356648 | 0.76% | 380 |
| chr22 | 844429 | 1.66% | 872 |
| chrX | 1168043 | 0.75% | 1108 |
| chrY | 43247 | 0.08% | 34 |
| 3342 contigs with no values (129077085 bp) | 0 | 0.00% | 0 |
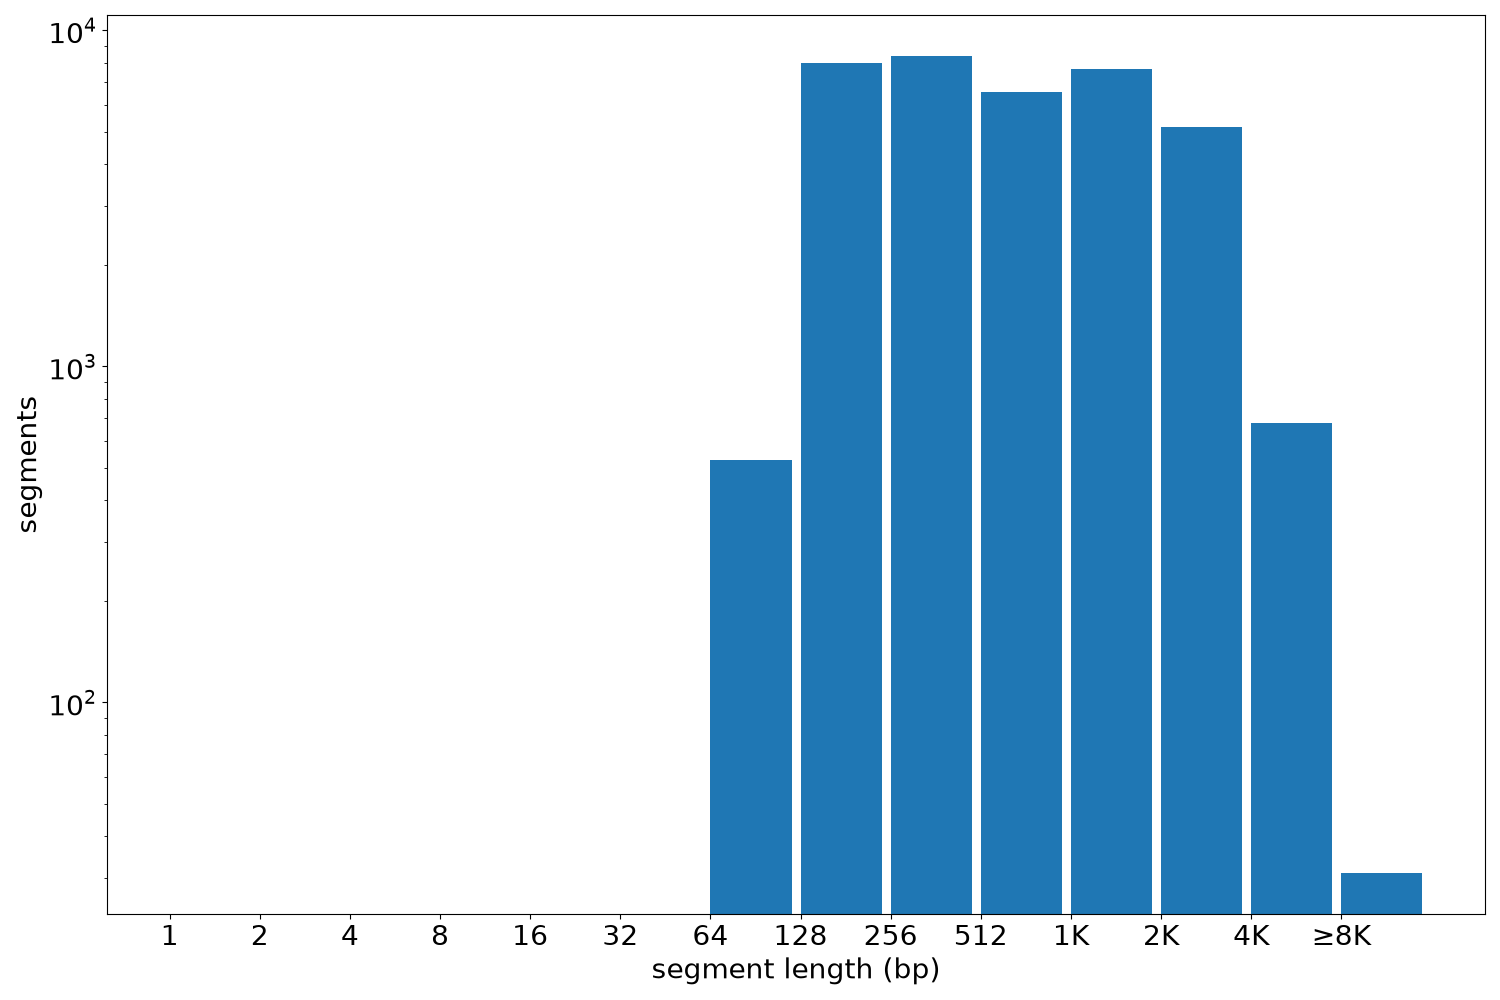
Segment lengths
| segments | min | max | mean | median | |
|---|---|---|---|---|---|
| segments | 37041 | 120 | 16470 | 1049.35 | 600 |
Files
| Filename | Size | md5 |
|---|---|---|
| ENCFF988TOJ.bed.gz | 855.23 KB | 2b8d4f3f2c7a4ebb377dcec6220ccf26 |
| ENCFF988TOJ.tabix.bed.gz | 400.17 KB | 18dcd2a7e5255894b7565f1c7c89d360 |
| ENCFF988TOJ.tabix.bed.gz.tbi | 175.06 KB | 369532d6cf0c0e824d3d2f111686bf0f |
| genomic_resource.yaml | 5.23 KB | 8696a1e3f90de80aabfd2445f971933a |
| statistics/ |