Resource
| Id | Histone_ChIP-seq/ENCSR000DPI |
|---|---|
| Type | position_score |
| Version | 0 |
| Summary | Histone_ChIP-seq ENCSR000DPI [biosample_summary="Homo sapiens AG04449" and target="H3K4me3"] |
| Description |
status: released biological_replicates: Rep 1, Rep 2 summary: output_type: replicated peaks audit_internal_action: Archived analysis {ENCAN338RSA|/analyses/ENCAN338RSA/} has in progress subobject quality standard {encode3-histone-chip|/quality-standards/encode3-histone-chip/} audit_warning: Processed alignments file {ENCFF243VRS|/files/ENCFF243VRS/} processed by ChIP-seq ENCODE3 GRCh38 pipeline has 19199707 usable fragments. The minimum ENCODE standard for each replicate in a ChIP-seq experiment targeting H3K4me3-human and investigated as a narrow histone mark is 10 million usable fragments. The recommended value is > 20 million, but > 10 million is acceptable. (See {ENCODE ChIP-seq data standards|/data-standards/chip-seq/}) audit_warning: Processed alignments file {ENCFF913YPV|/files/ENCFF913YPV/} processed by ChIP-seq ENCODE3 GRCh38 pipeline has 18462223 usable fragments. The minimum ENCODE standard for each replicate in a ChIP-seq experiment targeting H3K4me3-human and investigated as a narrow histone mark is 10 million usable fragments. The recommended value is > 20 million, but > 10 million is acceptable. (See {ENCODE ChIP-seq data standards|/data-standards/chip-seq/}) audit_warning: PBC1 (PCR Bottlenecking Coefficient 1, M1/M_distinct) is the ratio of the number of genomic locations where exactly one read maps uniquely (M1) to the number of genomic locations where some reads map (M_distinct). A PBC1 value in the range 0 - 0.5 is severe bottlenecking, 0.5 - 0.8 is moderate bottlenecking, 0.8 - 0.9 is mild bottlenecking, and > 0.9 is no bottlenecking. PBC1 value > 0.9 is recommended, but > 0.8 is acceptable. ENCODE processed alignments file {ENCFF243VRS|/files/ENCFF243VRS/} processed by ChIP-seq ENCODE3 GRCh38 pipeline was generated from a library with PBC1 value of 0.86. audit_warning: PBC2 (PCR Bottlenecking Coefficient 2, M1/M2) is the ratio of the number of genomic locations where exactly one read maps uniquely (M1) to the number of genomic locations where two reads map uniquely (M2). A PBC2 value in the range 0 - 1 is severe bottlenecking, 1 - 3 is moderate bottlenecking, 3 - 10 is mild bottlenecking, > 10 is no bottlenecking. PBC2 value > 10 is recommended, but > 3 is acceptable. ENCODE processed alignments file {ENCFF243VRS|/files/ENCFF243VRS/} processed by ChIP-seq ENCODE3 GRCh38 pipeline was generated from a library with PBC2 value of 8.08. audit_warning: PBC1 (PCR Bottlenecking Coefficient 1, M1/M_distinct) is the ratio of the number of genomic locations where exactly one read maps uniquely (M1) to the number of genomic locations where some reads map (M_distinct). A PBC1 value in the range 0 - 0.5 is severe bottlenecking, 0.5 - 0.8 is moderate bottlenecking, 0.8 - 0.9 is mild bottlenecking, and > 0.9 is no bottlenecking. PBC1 value > 0.9 is recommended, but > 0.8 is acceptable. ENCODE processed alignments file {ENCFF913YPV|/files/ENCFF913YPV/} processed by ChIP-seq ENCODE3 GRCh38 pipeline was generated from a library with PBC1 value of 0.84. audit_warning: PBC2 (PCR Bottlenecking Coefficient 2, M1/M2) is the ratio of the number of genomic locations where exactly one read maps uniquely (M1) to the number of genomic locations where two reads map uniquely (M2). A PBC2 value in the range 0 - 1 is severe bottlenecking, 1 - 3 is moderate bottlenecking, 3 - 10 is mild bottlenecking, > 10 is no bottlenecking. PBC2 value > 10 is recommended, but > 3 is acceptable. ENCODE processed alignments file {ENCFF913YPV|/files/ENCFF913YPV/} processed by ChIP-seq ENCODE3 GRCh38 pipeline was generated from a library with PBC2 value of 7.15. |
| Labels |
|
Scores (1)
| ID | Type | Default annotation | Description | Histogram | Range | Summary |
|---|---|---|---|---|---|---|
| Histone_ChIP-seq_ENCSR000DPI | float |
Histone_ChIP-seq_ENCSR000DPI |
Histone_ChIP-seq ENCSR000DPI [biosample_summary="Homo sapiens AG04449" and target="H3K4me3"]
|
 |
[2.01, 92.9] |
|
n counts base pairs; sd is the population standard deviation.
Coverage
| Chromosome | Covered positions | Covered % | Segments |
|---|---|---|---|
| all chromosomes | 35779596 | 1.11% | 37233 |
| chr1 | 3515755 | 1.41% | 3669 |
| chr1_KI270712v1_random | 182 | 0.10% | 1 |
| chr2 | 2488715 | 1.03% | 2559 |
| chr3 | 2048464 | 1.03% | 1994 |
| chr4 | 1398226 | 0.74% | 1363 |
| chr5 | 1756236 | 0.97% | 1739 |
| chr6 | 2118858 | 1.24% | 2117 |
| chr7 | 1671582 | 1.05% | 1773 |
| chr8 | 1342281 | 0.92% | 1393 |
| chr9 | 1462663 | 1.06% | 1593 |
| chr10 | 1511543 | 1.13% | 1551 |
| chr11 | 1981962 | 1.47% | 2003 |
| chr12 | 1952308 | 1.46% | 1926 |
| chr13 | 697301 | 0.61% | 748 |
| chr14 | 1149472 | 1.07% | 1168 |
| chr15 | 1198888 | 1.18% | 1244 |
| chr16 | 1419418 | 1.57% | 1540 |
| chr17 | 2081687 | 2.50% | 2250 |
| chr17_GL000205v2_random | 1846 | 0.99% | 3 |
| chr18 | 600182 | 0.75% | 644 |
| chr19 | 2248947 | 3.84% | 2529 |
| chr20 | 902106 | 1.40% | 980 |
| chr21 | 344418 | 0.74% | 385 |
| chr22 | 776331 | 1.53% | 861 |
| chr22_KI270733v1_random | 171 | 0.10% | 1 |
| chrUn_GL000195v1 | 276 | 0.15% | 2 |
| chrUn_GL000219v1 | 2252 | 1.26% | 9 |
| chrUn_GL000220v1 | 198 | 0.12% | 1 |
| chrX | 1067258 | 0.68% | 1154 |
| chrY | 40070 | 0.07% | 33 |
| 3336 contigs with no values (128011783 bp) | 0 | 0.00% | 0 |
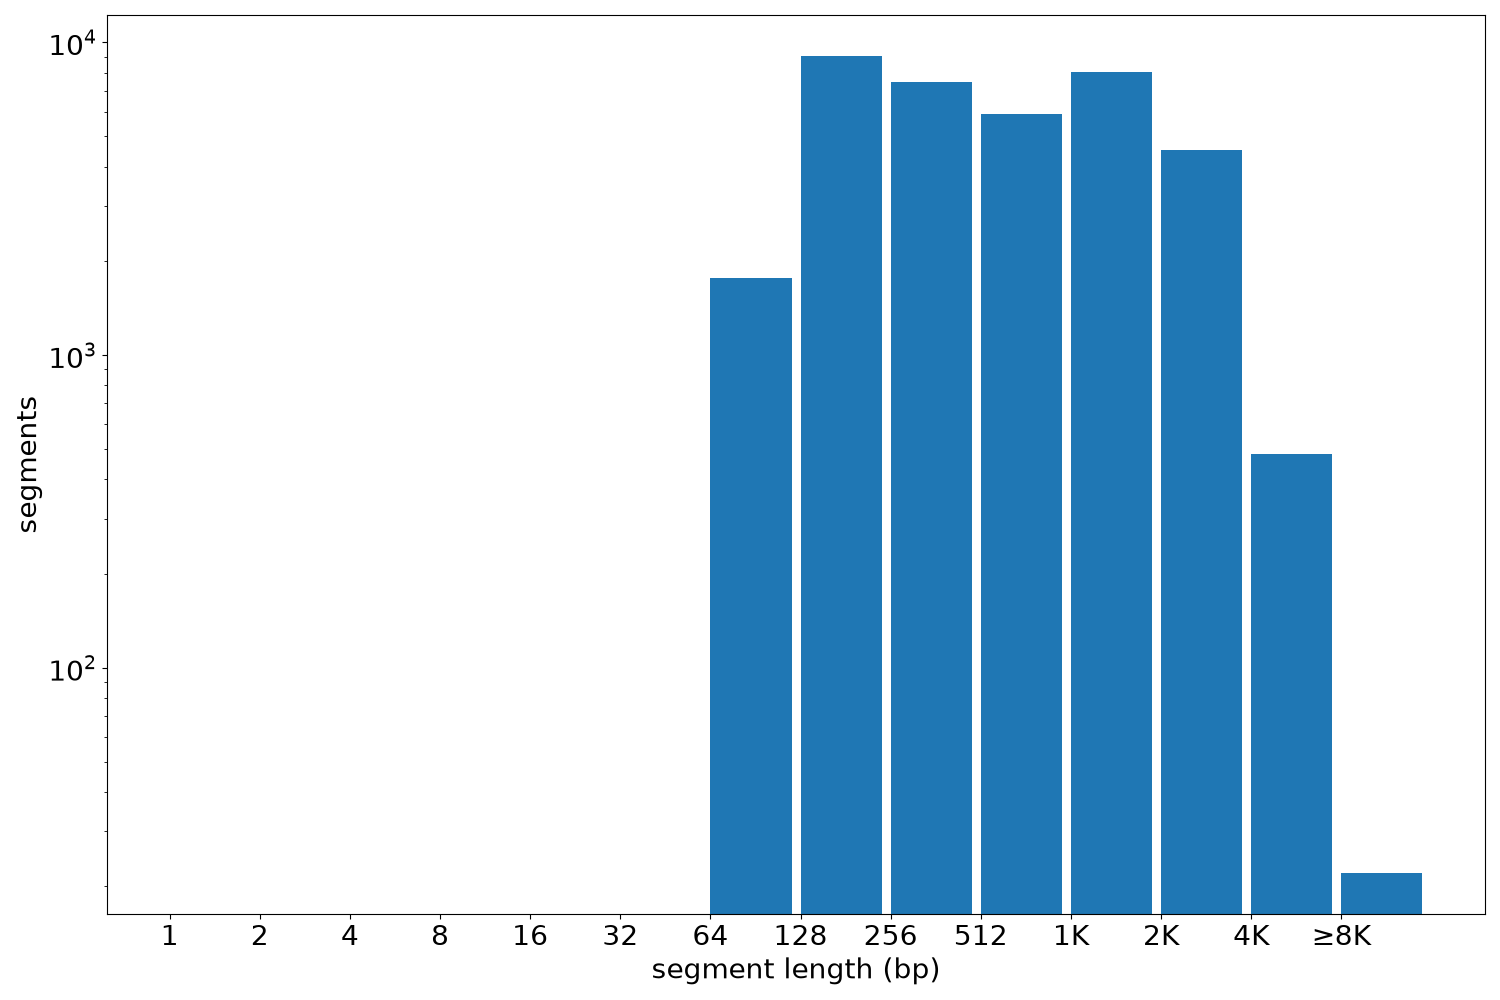
Segment lengths
| segments | min | max | mean | median | |
|---|---|---|---|---|---|
| segments | 37233 | 110 | 18435 | 960.96 | 531 |
Files
| Filename | Size | md5 |
|---|---|---|
| ENCFF901ZPG.bed.gz | 835.3 KB | fa29b6ce9df5328830f945f95b918f8a |
| ENCFF901ZPG.tabix.bed.gz | 396.28 KB | d181f17e6e30266dbede7403e3d9e8e5 |
| ENCFF901ZPG.tabix.bed.gz.tbi | 167.46 KB | 059e64dfbd966e727af5410a8f3de13f |
| genomic_resource.yaml | 5.26 KB | 91b4700753dc85c0b5ea7cb83b0ddd17 |
| statistics/ |