Resource
| Id | Histone_ChIP-seq/ENCSR000APY |
|---|---|
| Type | position_score |
| Version | 0 |
| Summary | Histone_ChIP-seq ENCSR000APY [biosample_summary="Homo sapiens H1" and target="H3K79me2"] |
| Description |
status: released biological_replicates: Rep 1, Rep 2 summary: output_type: pseudoreplicated peaks audit_internal_action: Released analysis {ENCAN022TXK|/analyses/ENCAN022TXK/} has in progress subobject quality standard {encode4-histone-chip|/quality-standards/encode4-histone-chip/} audit_not_compliant: Processed alignments file {ENCFF996IVI|/files/ENCFF996IVI/} processed by ChIP-seq ENCODE4 v1.8.1 GRCh38 pipeline has 21692486 usable fragments. The minimum ENCODE standard for each replicate in a ChIP-seq experiment targeting H3K79me2-human and investigated as a broad histone mark is 20 million usable fragments. The recommended value is > 45 million, but > 35 million is acceptable. (See {ENCODE ChIP-seq data standards|/data-standards/chip-seq/}) audit_not_compliant: Processed alignments file {ENCFF263PXM|/files/ENCFF263PXM/} processed by ChIP-seq ENCODE4 v1.8.1 GRCh38 pipeline has 32432355 usable fragments. The minimum ENCODE standard for each replicate in a ChIP-seq experiment targeting H3K79me2-human and investigated as a broad histone mark is 20 million usable fragments. The recommended value is > 45 million, but > 35 million is acceptable. (See {ENCODE ChIP-seq data standards|/data-standards/chip-seq/}) audit_warning: PBC1 (PCR Bottlenecking Coefficient 1, M1/M_distinct) is the ratio of the number of genomic locations where exactly one read maps uniquely (M1) to the number of genomic locations where some reads map (M_distinct). A PBC1 value in the range 0 - 0.5 is severe bottlenecking, 0.5 - 0.8 is moderate bottlenecking, 0.8 - 0.9 is mild bottlenecking, and > 0.9 is no bottlenecking. PBC1 value > 0.9 is recommended, but > 0.8 is acceptable. ENCODE processed alignments file {ENCFF996IVI|/files/ENCFF996IVI/} processed by ChIP-seq ENCODE4 v1.8.1 GRCh38 pipeline was generated from a library with PBC1 value of 0.89. audit_warning: PBC2 (PCR Bottlenecking Coefficient 2, M1/M2) is the ratio of the number of genomic locations where exactly one read maps uniquely (M1) to the number of genomic locations where two reads map uniquely (M2). A PBC2 value in the range 0 - 1 is severe bottlenecking, 1 - 3 is moderate bottlenecking, 3 - 10 is mild bottlenecking, > 10 is no bottlenecking. PBC2 value > 10 is recommended, but > 3 is acceptable. ENCODE processed alignments file {ENCFF996IVI|/files/ENCFF996IVI/} processed by ChIP-seq ENCODE4 v1.8.1 GRCh38 pipeline was generated from a library with PBC2 value of 9.33. |
| Labels |
|
Scores (1)
| ID | Type | Default annotation | Description | Histogram | Range | Summary |
|---|---|---|---|---|---|---|
| Histone_ChIP-seq_ENCSR000APY | float |
Histone_ChIP-seq_ENCSR000APY |
Histone_ChIP-seq ENCSR000APY [biosample_summary="Homo sapiens H1" and target="H3K79me2"]
|
 |
[1.93, 46.8] |
|
n counts base pairs; sd is the population standard deviation.
Coverage
| Chromosome | Covered positions | Covered % | Segments |
|---|---|---|---|
| all chromosomes | 115592643 | 3.59% | 93818 |
| chr1 | 10975053 | 4.41% | 8777 |
| chr2 | 9753032 | 4.03% | 7255 |
| chr3 | 7560231 | 3.81% | 6104 |
| chr4 | 5594787 | 2.94% | 4712 |
| chr5 | 6295297 | 3.47% | 4702 |
| chr6 | 6773001 | 3.97% | 5335 |
| chr7 | 6506084 | 4.08% | 5577 |
| chr8 | 5413972 | 3.73% | 4050 |
| chr9 | 5004244 | 3.62% | 4551 |
| chr10 | 5400751 | 4.04% | 4326 |
| chr11 | 4910187 | 3.63% | 4124 |
| chr12 | 5705227 | 4.28% | 4661 |
| chr13 | 3011843 | 2.63% | 2319 |
| chr14 | 3737179 | 3.49% | 3117 |
| chr15 | 4063985 | 3.98% | 3077 |
| chr16 | 3834227 | 4.24% | 3318 |
| chr17 | 4665400 | 5.60% | 4256 |
| chr18 | 2432650 | 3.03% | 1883 |
| chr19 | 3934298 | 6.71% | 3522 |
| chr20 | 2657747 | 4.12% | 2076 |
| chr21 | 1222281 | 2.62% | 776 |
| chr22 | 2607816 | 5.13% | 2094 |
| chrX | 3205164 | 2.05% | 2930 |
| chrY | 328187 | 0.57% | 276 |
| 3342 contigs with no values (129077085 bp) | 0 | 0.00% | 0 |
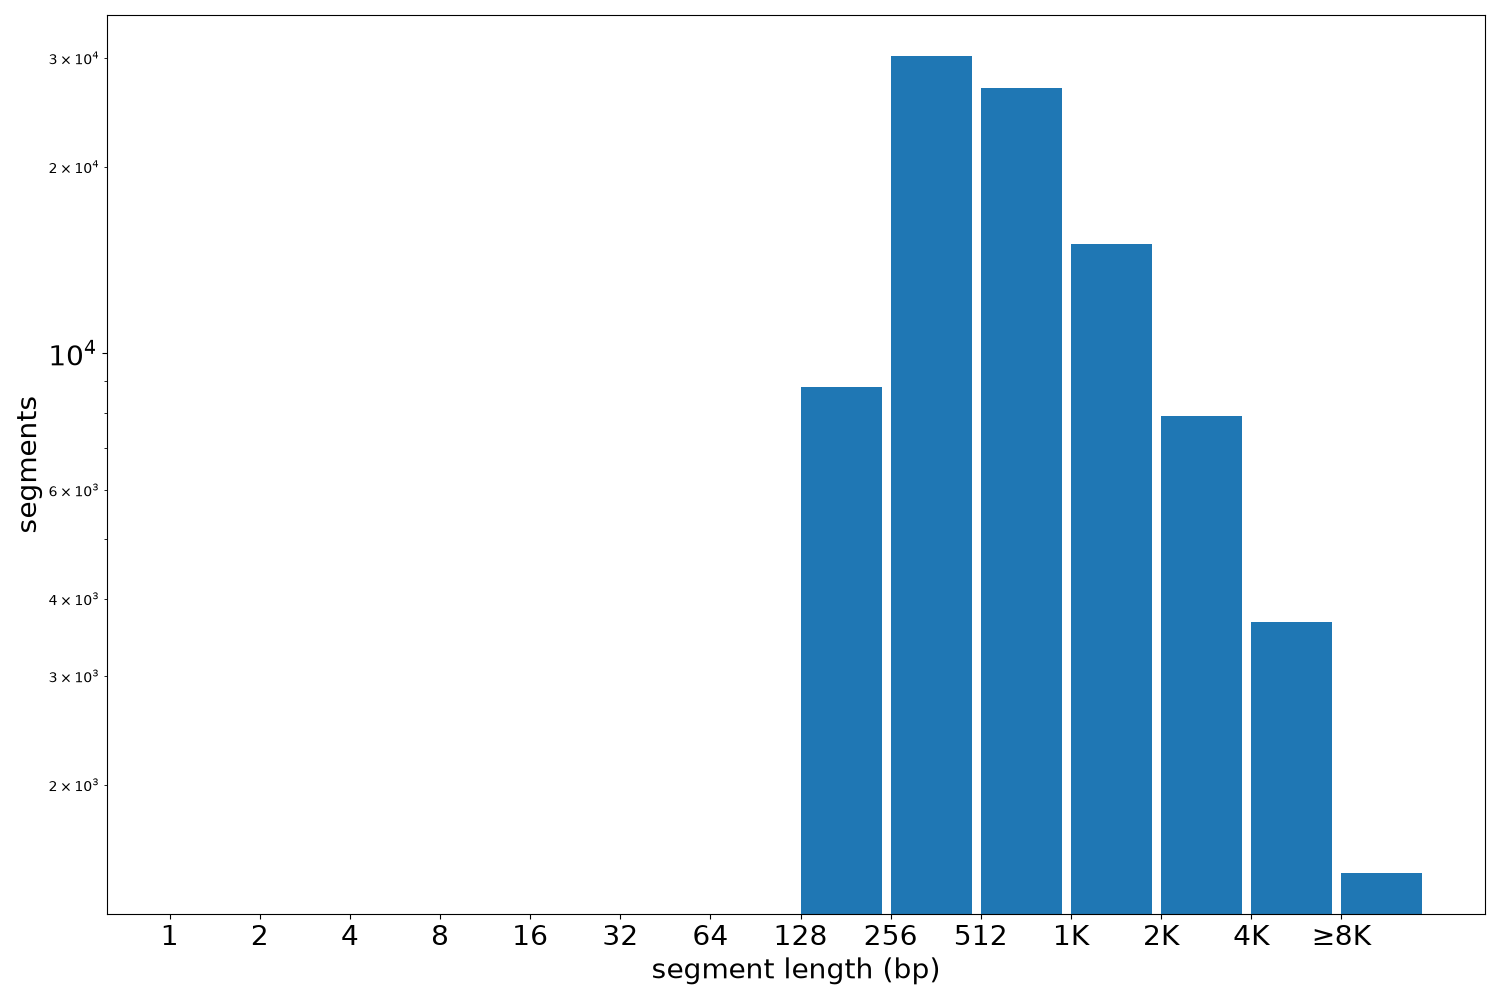
Segment lengths
| segments | min | max | mean | median | |
|---|---|---|---|---|---|
| segments | 93818 | 145 | 90905 | 1232.09 | 608 |
Files
| Filename | Size | md5 |
|---|---|---|
| ENCFF792SGR.bed.gz | 2.24 MB | 88e887bf1ae6a4c15f7c5d1ba48ff61e |
| ENCFF792SGR.tabix.bed.gz | 996.25 KB | 6974a3bcb3b2e7a00807e960812fcaca |
| ENCFF792SGR.tabix.bed.gz.tbi | 128.22 KB | 943b9391170335c9fd06c1e387261b8f |
| genomic_resource.yaml | 3.7 KB | aafefb6de3b1627197f0a644c01b5881 |
| statistics/ |