Resource
| Id | DNase-seq/ENCSR995YPS |
|---|---|
| Type | position_score |
| Version | 0 |
| Summary | DNase-seq ENCSR995YPS [biosample_summary="Homo sapiens with mild cognitive impairment; dorsolateral prefrontal cortex tissue female adult (87 years)"] |
| Description |
status: released biological_replicates: Rep 1 summary: female adult (87 years) with mild cognitive impairment output_type: peaks audit_warning: Signal Portion of Tags (SPOT) is a measure of enrichment, analogous to the commonly used fraction of reads in peaks metric. ENCODE processed alignment files {ENCFF984QXK|/files/ENCFF984QXK/} processed by DNase-seq ENCODE4 v3.0.0-alpha.2 GRCh38 pipeline ({ENCPL848KLD|/pipelines/ENCPL848KLD/}) for GRCh38 assembly have a SPOT1 score of 0.31. According to ENCODE standards, SPOT1 score of 0.4 or higher is considered a product of high quality data. Any sample with a SPOT1 score <0.3 should be targeted for replacement with a higher quality sample, and a SPOT1 score of 0.25 is considered minimally acceptable SPOT1 score of 0.25 is considered minimally acceptable for rare and hard to find primary tissues. (See {ENCODE DNase-seq data standards|/data-standards/dnase-seq-encode4/}) |
| Labels |
|
Scores (1)
| ID | Type | Default annotation | Description | Histogram | Range | Summary |
|---|---|---|---|---|---|---|
| DNase-seq_ENCSR995YPS | float |
DNase-seq_ENCSR995YPS |
DNase-seq ENCSR995YPS [biosample_summary="Homo sapiens with mild cognitive impairment; dorsolateral prefrontal cortex tissue female adult (87 years)"]
|
 |
[0.0582, 13.7] |
|
n counts base pairs; sd is the population standard deviation.
Coverage
| Chromosome | Covered positions | Covered % | Segments |
|---|---|---|---|
| all chromosomes | 13624090 | 0.42% | 69029 |
| chr1 | 1285748 | 0.52% | 6515 |
| chr2 | 1213348 | 0.50% | 6204 |
| chr3 | 768521 | 0.39% | 3905 |
| chr4 | 431610 | 0.23% | 2209 |
| chr5 | 687673 | 0.38% | 3525 |
| chr6 | 646788 | 0.38% | 3301 |
| chr7 | 647145 | 0.41% | 3275 |
| chr8 | 643394 | 0.44% | 3277 |
| chr9 | 598006 | 0.43% | 3035 |
| chr10 | 850580 | 0.64% | 4260 |
| chr11 | 783632 | 0.58% | 3938 |
| chr12 | 556339 | 0.42% | 2803 |
| chr13 | 256310 | 0.22% | 1308 |
| chr14 | 460696 | 0.43% | 2315 |
| chr15 | 498525 | 0.49% | 2579 |
| chr16 | 479633 | 0.53% | 2430 |
| chr17 | 648289 | 0.78% | 3266 |
| chr18 | 304551 | 0.38% | 1584 |
| chr19 | 626721 | 1.07% | 2959 |
| chr20 | 431742 | 0.67% | 2242 |
| chr21 | 151601 | 0.32% | 798 |
| chr22 | 381197 | 0.75% | 1929 |
| chrX | 271548 | 0.17% | 1368 |
| chrY | 493 | <0.01% | 4 |
| 3342 contigs with no values (129077085 bp) | 0 | 0.00% | 0 |
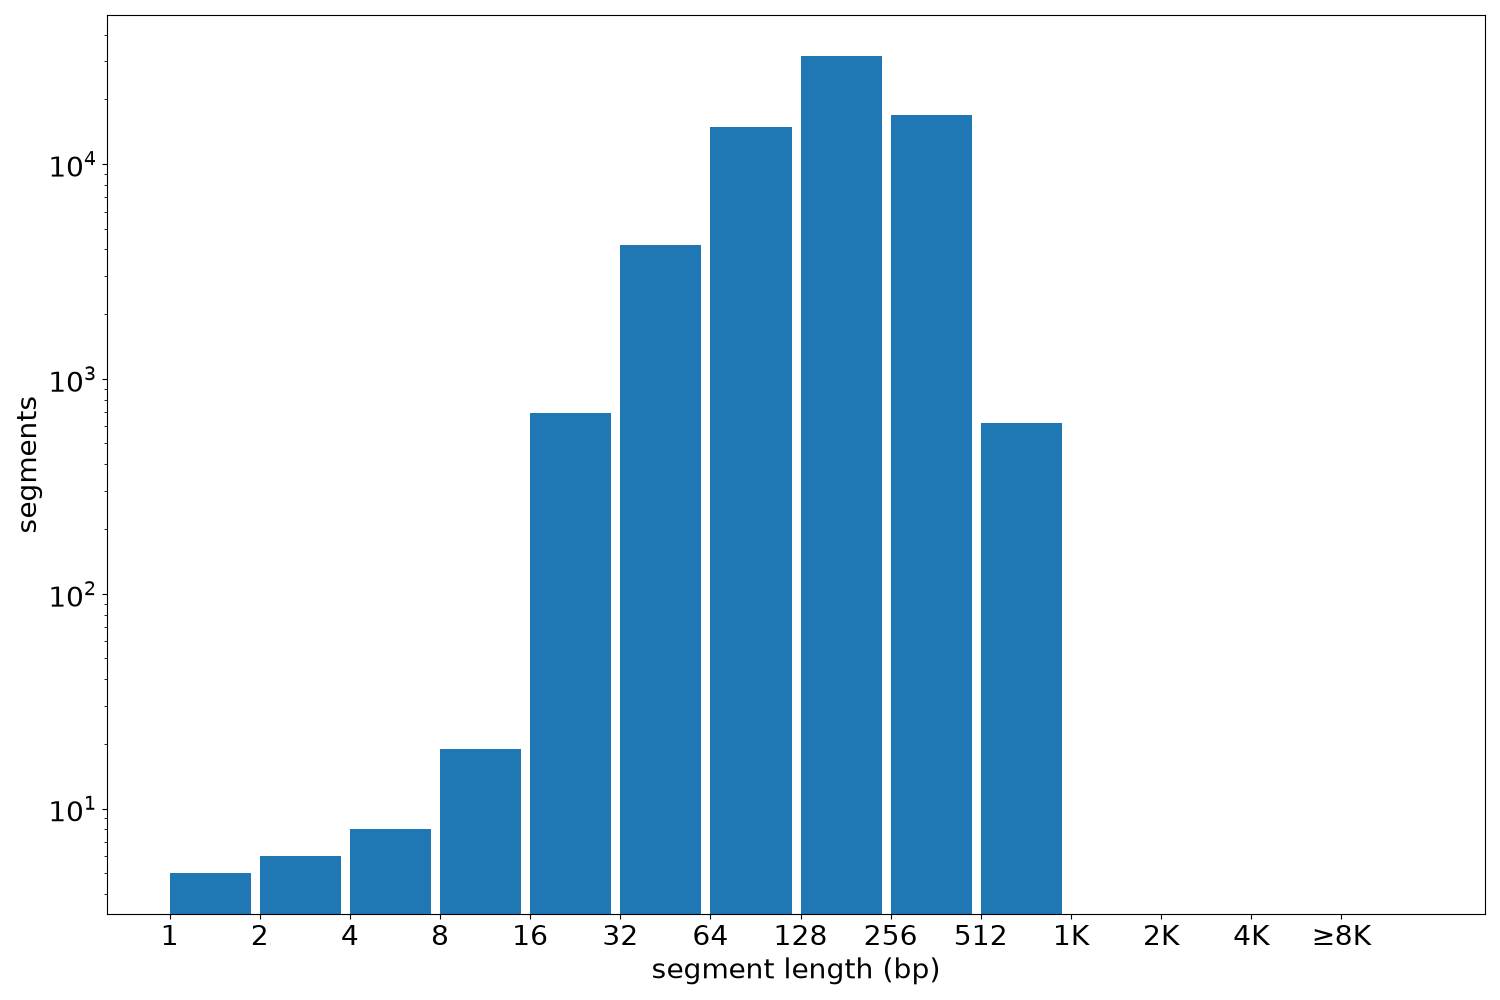
Segment lengths
| segments | min | max | mean | median | |
|---|---|---|---|---|---|
| segments | 69029 | 1 | 1020 | 197.37 | 200 |
Files
| Filename | Size | md5 |
|---|---|---|
| ENCFF639OCZ.bed.gz | 735.58 KB | 25875ddd9558184fd2611285d547848e |
| ENCFF639OCZ.tabix.bed.gz | 671.03 KB | 37a60af70362a92742ed356628d3d72e |
| ENCFF639OCZ.tabix.bed.gz.tbi | 274.27 KB | b4d17051bf038b87a18fef6f1dcd492c |
| genomic_resource.yaml | 2.26 KB | c51625518893990b5287694444107940 |
| statistics/ |