Resource
| Id | DNase-seq/ENCSR974TXT |
|---|---|
| Type | position_score |
| Version | 0 |
| Summary | DNase-seq ENCSR974TXT [biosample_summary="Homo sapiens left kidney tissue female embryo (110 days)"] |
| Description |
status: released biological_replicates: Rep 1 summary: female embryo (110 days) output_type: peaks audit_warning: Alignment file {ENCFF359EXU|/files/ENCFF359EXU/} processed by DNase-seq ENCODE4 v3.0.0-alpha.2 GRCh38 pipeline ( {ENCPL848KLD|/pipelines/ENCPL848KLD/} ) for GRCh38 assembly has 34718490 mapped reads. According to ENCODE standards, conventional DNase-seq profile requires a minimum of 20 million uniquely mapped reads to generate a reliable SPOT (Signal Portion of Tags) score. The recommended value is > 50 million. For deep, foot-printing depth DNase-seq 150-200 million uniquely mapped reads are recommended. (See {ENCODE DNase-seq data standards|/data-standards/dnase-seq-encode4/}) audit_warning: Signal Portion of Tags (SPOT) is a measure of enrichment, analogous to the commonly used fraction of reads in peaks metric. ENCODE processed alignment files {ENCFF359EXU|/files/ENCFF359EXU/} processed by DNase-seq ENCODE4 v3.0.0-alpha.2 GRCh38 pipeline ({ENCPL848KLD|/pipelines/ENCPL848KLD/}) for GRCh38 assembly have a SPOT1 score of 0.34. According to ENCODE standards, SPOT1 score of 0.4 or higher is considered a product of high quality data. Any sample with a SPOT1 score <0.3 should be targeted for replacement with a higher quality sample, and a SPOT1 score of 0.25 is considered minimally acceptable SPOT1 score of 0.25 is considered minimally acceptable for rare and hard to find primary tissues. (See {ENCODE DNase-seq data standards|/data-standards/dnase-seq-encode4/}) |
| Labels |
|
Scores (1)
| ID | Type | Default annotation | Description | Histogram | Range | Summary |
|---|---|---|---|---|---|---|
| DNase-seq_ENCSR974TXT | float |
DNase-seq_ENCSR974TXT |
DNase-seq ENCSR974TXT [biosample_summary="Homo sapiens left kidney tissue female embryo (110 days)"]
|
 |
[0.231, 8.18] |
|
n counts base pairs; sd is the population standard deviation.
Coverage
| Chromosome | Covered positions | Covered % | Segments |
|---|---|---|---|
| all chromosomes | 7897821 | 0.25% | 39203 |
| chr1 | 741772 | 0.30% | 3616 |
| chr2 | 648411 | 0.27% | 3190 |
| chr3 | 526037 | 0.27% | 2608 |
| chr4 | 417378 | 0.22% | 2047 |
| chr5 | 454498 | 0.25% | 2244 |
| chr6 | 505163 | 0.30% | 2477 |
| chr7 | 399794 | 0.25% | 2026 |
| chr8 | 331799 | 0.23% | 1704 |
| chr9 | 315178 | 0.23% | 1601 |
| chr10 | 368680 | 0.28% | 1854 |
| chr11 | 396134 | 0.29% | 1968 |
| chr12 | 413969 | 0.31% | 2043 |
| chr13 | 205237 | 0.18% | 1025 |
| chr14 | 271042 | 0.25% | 1288 |
| chr15 | 266927 | 0.26% | 1314 |
| chr16 | 227445 | 0.25% | 1158 |
| chr17 | 318876 | 0.38% | 1585 |
| chr18 | 156540 | 0.19% | 798 |
| chr19 | 362387 | 0.62% | 1672 |
| chr20 | 174300 | 0.27% | 917 |
| chr21 | 73069 | 0.16% | 366 |
| chr22 | 114164 | 0.22% | 596 |
| chrX | 208745 | 0.13% | 1104 |
| chrY | 276 | <0.01% | 2 |
| 3342 contigs with no values (129077085 bp) | 0 | 0.00% | 0 |
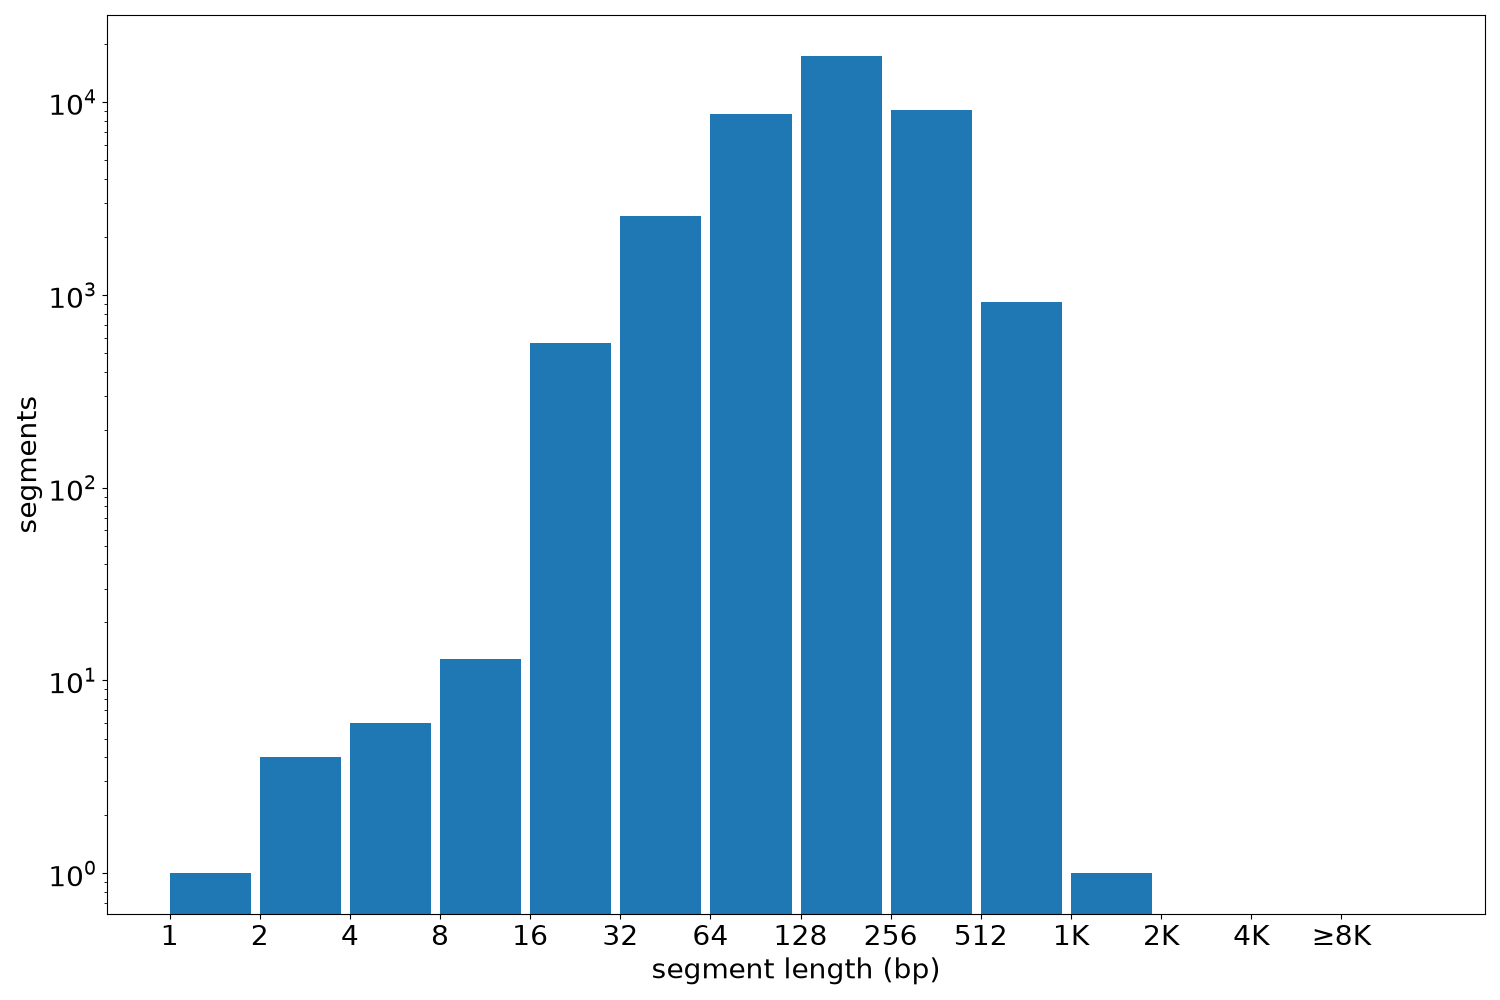
Segment lengths
| segments | min | max | mean | median | |
|---|---|---|---|---|---|
| segments | 39203 | 1 | 1054 | 201.46 | 180 |
Files
| Filename | Size | md5 |
|---|---|---|
| ENCFF774RGC.bed.gz | 390.6 KB | ffc021fb89199bd60ec82f008d013c43 |
| ENCFF774RGC.tabix.bed.gz | 360.49 KB | 740f5b33d246e95aea80bf0fdbc477ef |
| ENCFF774RGC.tabix.bed.gz.tbi | 194.41 KB | 6eaa769cd9803ab606eb66bf814cc884 |
| genomic_resource.yaml | 2.67 KB | 84e3557a8febc527809667c137f061fd |
| statistics/ |