Resource
| Id | DNase-seq/ENCSR964WHY |
|---|---|
| Type | position_score |
| Version | 0 |
| Summary | DNase-seq ENCSR964WHY [biosample_summary="Homo sapiens H9 G1b phase stably expressing CDT1, stably expressing GMNN"] |
| Description |
status: released biological_replicates: Rep 1 summary: stably expressing C-terminal DsRed-tagged CDT1, stably expressing N-terminal eGFP-tagged GMNN G1b phase output_type: peaks audit_error: Signal Portion of Tags (SPOT) is a measure of enrichment, analogous to the commonly used fraction of reads in peaks metric. ENCODE processed alignment files {ENCFF308PNO|/files/ENCFF308PNO/} processed by DNase-seq ENCODE4 v3.0.0-alpha.2 GRCh38 pipeline ({ENCPL848KLD|/pipelines/ENCPL848KLD/}) for GRCh38 assembly have a SPOT1 score of 0.23. According to ENCODE standards, SPOT1 score of 0.4 or higher is considered a product of high quality data. Any sample with a SPOT1 score <0.3 should be targeted for replacement with a higher quality sample, and a SPOT1 score of 0.25 is considered minimally acceptable SPOT1 score of 0.25 is considered minimally acceptable for rare and hard to find primary tissues. (See {ENCODE DNase-seq data standards|/data-standards/dnase-seq-encode4/}) audit_warning: Signal Portion of Tags (SPOT) is a measure of enrichment, analogous to the commonly used fraction of reads in peaks metric. ENCODE processed alignment files {ENCFF347LOI|/files/ENCFF347LOI/} processed by DNase-seq ENCODE4 v3.0.0-alpha.2 GRCh38 pipeline ({ENCPL848KLD|/pipelines/ENCPL848KLD/}) for GRCh38 assembly have a SPOT1 score of 0.29. According to ENCODE standards, SPOT1 score of 0.4 or higher is considered a product of high quality data. Any sample with a SPOT1 score <0.3 should be targeted for replacement with a higher quality sample, and a SPOT1 score of 0.25 is considered minimally acceptable SPOT1 score of 0.25 is considered minimally acceptable for rare and hard to find primary tissues. (See {ENCODE DNase-seq data standards|/data-standards/dnase-seq-encode4/}) |
| Labels |
|
Scores (1)
| ID | Type | Default annotation | Description | Histogram | Range | Summary |
|---|---|---|---|---|---|---|
| DNase-seq_ENCSR964WHY | float |
DNase-seq_ENCSR964WHY |
DNase-seq ENCSR964WHY [biosample_summary="Homo sapiens H9 G1b phase stably expressing CDT1, stably expressing GMNN"]
|
 |
[0.029, 12.2] |
|
n counts base pairs; sd is the population standard deviation.
Coverage
| Chromosome | Covered positions | Covered % | Segments |
|---|---|---|---|
| all chromosomes | 21014588 | 0.65% | 103472 |
| chr1 | 1949652 | 0.78% | 9513 |
| chr2 | 1573591 | 0.65% | 7784 |
| chr3 | 1257062 | 0.63% | 6197 |
| chr4 | 1000704 | 0.53% | 4938 |
| chr5 | 1120277 | 0.62% | 5495 |
| chr6 | 1272434 | 0.74% | 6139 |
| chr7 | 1057948 | 0.66% | 5289 |
| chr8 | 933721 | 0.64% | 4627 |
| chr9 | 894970 | 0.65% | 4460 |
| chr10 | 990909 | 0.74% | 4913 |
| chr11 | 1124598 | 0.83% | 5512 |
| chr12 | 1053932 | 0.79% | 5135 |
| chr13 | 508615 | 0.44% | 2564 |
| chr14 | 673685 | 0.63% | 3288 |
| chr15 | 687232 | 0.67% | 3387 |
| chr16 | 714637 | 0.79% | 3553 |
| chr17 | 974986 | 1.17% | 4719 |
| chr18 | 345958 | 0.43% | 1788 |
| chr19 | 995461 | 1.70% | 4711 |
| chr20 | 572133 | 0.89% | 2862 |
| chr21 | 205386 | 0.44% | 1050 |
| chr22 | 390720 | 0.77% | 1962 |
| chrX | 714760 | 0.46% | 3575 |
| chrY | 1217 | <0.01% | 11 |
| 3342 contigs with no values (129077085 bp) | 0 | 0.00% | 0 |
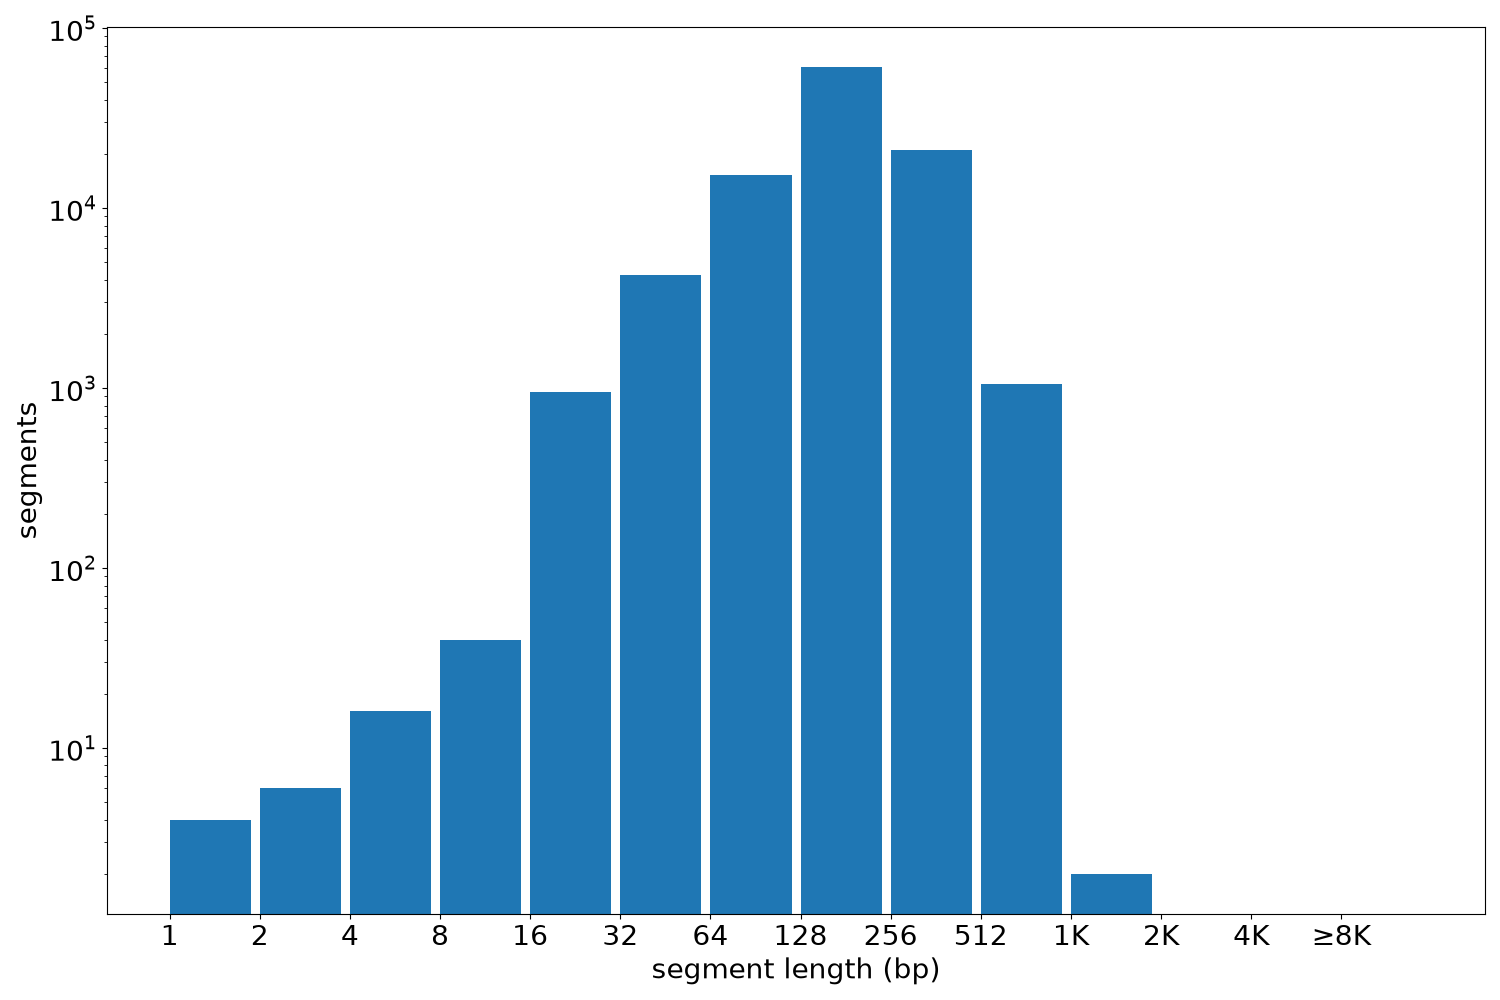
Segment lengths
| segments | min | max | mean | median | |
|---|---|---|---|---|---|
| segments | 103472 | 1 | 1258 | 203.09 | 200 |
Files
| Filename | Size | md5 |
|---|---|---|
| ENCFF736LDI.bed.gz | 1.1 MB | e8a8a8b95510868624d003c606d2782e |
| ENCFF736LDI.tabix.bed.gz | 1.01 MB | 03fb466eed972363de928770c9ad9a67 |
| ENCFF736LDI.tabix.bed.gz.tbi | 433.43 KB | a4ba07df8460d9e997bd6aa68b8120e5 |
| genomic_resource.yaml | 3.08 KB | 63b315bdbe6559d5c0def1051ea70a54 |
| statistics/ |