Resource
| Id | DNase-seq/ENCSR922YEW |
|---|---|
| Type | position_score |
| Version | 0 |
| Summary | DNase-seq ENCSR922YEW [biosample_summary="Homo sapiens placenta tissue female embryo"] |
| Description |
status: released biological_replicates: Rep 1 summary: female embryo output_type: peaks audit_warning: Signal Portion of Tags (SPOT) is a measure of enrichment, analogous to the commonly used fraction of reads in peaks metric. ENCODE processed alignment files {ENCFF847XBC|/files/ENCFF847XBC/} processed by DNase-seq ENCODE4 v3.0.0-alpha.2 GRCh38 pipeline ({ENCPL848KLD|/pipelines/ENCPL848KLD/}) for GRCh38 assembly have a SPOT1 score of 0.38. According to ENCODE standards, SPOT1 score of 0.4 or higher is considered a product of high quality data. Any sample with a SPOT1 score <0.3 should be targeted for replacement with a higher quality sample, and a SPOT1 score of 0.25 is considered minimally acceptable SPOT1 score of 0.25 is considered minimally acceptable for rare and hard to find primary tissues. (See {ENCODE DNase-seq data standards|/data-standards/dnase-seq-encode4/}) |
| Labels |
|
Scores (1)
| ID | Type | Default annotation | Description | Histogram | Range | Summary |
|---|---|---|---|---|---|---|
| DNase-seq_ENCSR922YEW | float |
DNase-seq_ENCSR922YEW |
DNase-seq ENCSR922YEW [biosample_summary="Homo sapiens placenta tissue female embryo"]
|
 |
[0.0287, 20.2] |
|
n counts base pairs; sd is the population standard deviation.
Coverage
| Chromosome | Covered positions | Covered % | Segments |
|---|---|---|---|
| all chromosomes | 41865237 | 1.30% | 209588 |
| chr1 | 3776381 | 1.52% | 18924 |
| chr2 | 3832755 | 1.58% | 18865 |
| chr3 | 2014471 | 1.02% | 10259 |
| chr4 | 1183615 | 0.62% | 6031 |
| chr5 | 2000399 | 1.10% | 10094 |
| chr6 | 1784815 | 1.04% | 9248 |
| chr7 | 2323198 | 1.46% | 11627 |
| chr8 | 1858769 | 1.28% | 9293 |
| chr9 | 1824902 | 1.32% | 9206 |
| chr10 | 2505644 | 1.87% | 12445 |
| chr11 | 2225086 | 1.65% | 10935 |
| chr12 | 1674559 | 1.26% | 8652 |
| chr13 | 800760 | 0.70% | 4051 |
| chr14 | 1562223 | 1.46% | 7663 |
| chr15 | 1683982 | 1.65% | 8420 |
| chr16 | 1609216 | 1.78% | 8119 |
| chr17 | 2077257 | 2.49% | 10352 |
| chr18 | 873893 | 1.09% | 4397 |
| chr19 | 1703431 | 2.91% | 8599 |
| chr20 | 1419588 | 2.20% | 7002 |
| chr21 | 712871 | 1.53% | 3517 |
| chr22 | 1285603 | 2.53% | 6191 |
| chrX | 1129286 | 0.72% | 5677 |
| chrY | 2533 | <0.01% | 21 |
| 3342 contigs with no values (129077085 bp) | 0 | 0.00% | 0 |
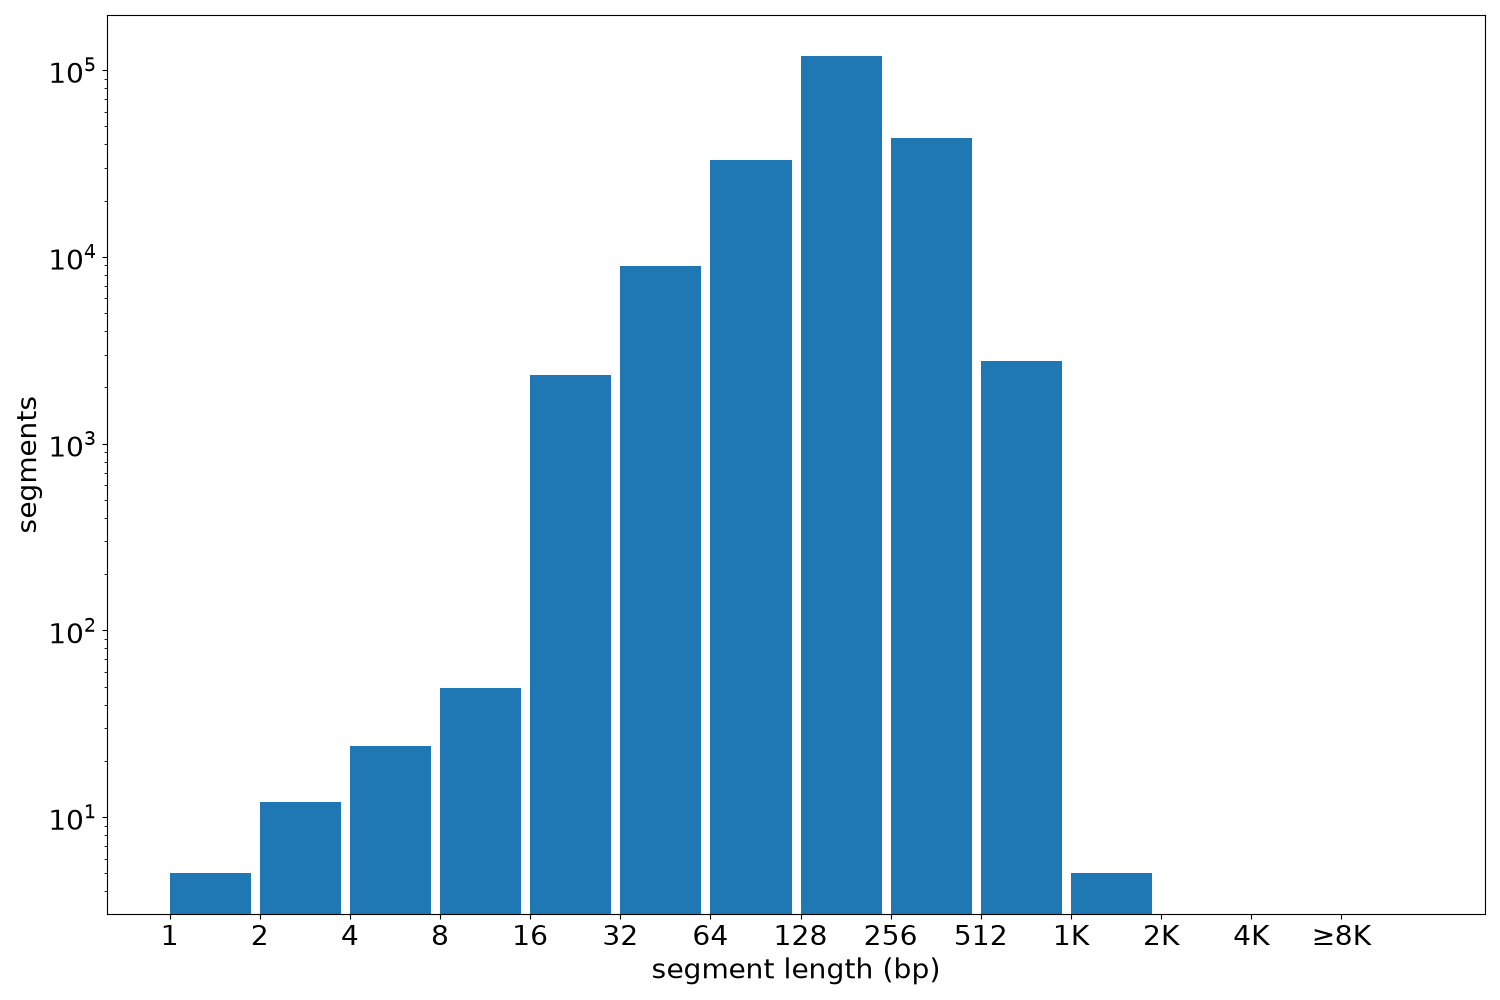
Segment lengths
| segments | min | max | mean | median | |
|---|---|---|---|---|---|
| segments | 209588 | 1 | 1160 | 199.75 | 180 |
Files
| Filename | Size | md5 |
|---|---|---|
| ENCFF259CAA.bed.gz | 2.08 MB | 6269bf7b784d9d68f399a71ae4ff6d0a |
| ENCFF259CAA.tabix.bed.gz | 1.94 MB | c9a7a2cfc6a61e5d55e2567eee20a327 |
| ENCFF259CAA.tabix.bed.gz.tbi | 375.82 KB | b5b78054dd4257d7a61f745c4fe6010c |
| genomic_resource.yaml | 1.98 KB | b2c9e96b3d9dccf8d601bf9e4037ab56 |
| statistics/ |