Resource
| Id | DNase-seq/ENCSR888UPQ |
|---|---|
| Type | position_score |
| Version | 0 |
| Summary | DNase-seq ENCSR888UPQ [biosample_summary="Homo sapiens thymus tissue male embryo (108 days)"] |
| Description |
status: released biological_replicates: Rep 1 summary: male embryo (108 days) output_type: peaks audit_warning: Alignment file {ENCFF945FMY|/files/ENCFF945FMY/} processed by DNase-seq ENCODE4 v3.0.0-alpha.2 GRCh38 pipeline ( {ENCPL848KLD|/pipelines/ENCPL848KLD/} ) for GRCh38 assembly has 27188033 mapped reads. According to ENCODE standards, conventional DNase-seq profile requires a minimum of 20 million uniquely mapped reads to generate a reliable SPOT (Signal Portion of Tags) score. The recommended value is > 50 million. For deep, foot-printing depth DNase-seq 150-200 million uniquely mapped reads are recommended. (See {ENCODE DNase-seq data standards|/data-standards/dnase-seq-encode4/}) audit_warning: Signal Portion of Tags (SPOT) is a measure of enrichment, analogous to the commonly used fraction of reads in peaks metric. ENCODE processed alignment files {ENCFF945FMY|/files/ENCFF945FMY/} processed by DNase-seq ENCODE4 v3.0.0-alpha.2 GRCh38 pipeline ({ENCPL848KLD|/pipelines/ENCPL848KLD/}) for GRCh38 assembly have a SPOT1 score of 0.27. According to ENCODE standards, SPOT1 score of 0.4 or higher is considered a product of high quality data. Any sample with a SPOT1 score <0.3 should be targeted for replacement with a higher quality sample, and a SPOT1 score of 0.25 is considered minimally acceptable SPOT1 score of 0.25 is considered minimally acceptable for rare and hard to find primary tissues. (See {ENCODE DNase-seq data standards|/data-standards/dnase-seq-encode4/}) |
| Labels |
|
Scores (1)
| ID | Type | Default annotation | Description | Histogram | Range | Summary |
|---|---|---|---|---|---|---|
| DNase-seq_ENCSR888UPQ | float |
DNase-seq_ENCSR888UPQ |
DNase-seq ENCSR888UPQ [biosample_summary="Homo sapiens thymus tissue male embryo (108 days)"]
|
 |
[0.295, 16.2] |
|
n counts base pairs; sd is the population standard deviation.
Coverage
| Chromosome | Covered positions | Covered % | Segments |
|---|---|---|---|
| all chromosomes | 6197195 | 0.19% | 34557 |
| chr1 | 609973 | 0.25% | 3385 |
| chr2 | 466577 | 0.19% | 2626 |
| chr3 | 397236 | 0.20% | 2239 |
| chr4 | 273940 | 0.14% | 1522 |
| chr5 | 311179 | 0.17% | 1752 |
| chr6 | 386789 | 0.23% | 2139 |
| chr7 | 306528 | 0.19% | 1716 |
| chr8 | 232299 | 0.16% | 1331 |
| chr9 | 252561 | 0.18% | 1420 |
| chr10 | 288068 | 0.22% | 1602 |
| chr11 | 312452 | 0.23% | 1753 |
| chr12 | 323164 | 0.24% | 1795 |
| chr13 | 142132 | 0.12% | 781 |
| chr14 | 203113 | 0.19% | 1136 |
| chr15 | 199470 | 0.20% | 1120 |
| chr16 | 217736 | 0.24% | 1225 |
| chr17 | 312764 | 0.38% | 1731 |
| chr18 | 117457 | 0.15% | 675 |
| chr19 | 335854 | 0.57% | 1740 |
| chr20 | 161114 | 0.25% | 919 |
| chr21 | 70652 | 0.15% | 386 |
| chr22 | 122890 | 0.24% | 702 |
| chrX | 147137 | 0.09% | 824 |
| chrY | 6110 | 0.01% | 38 |
| 3342 contigs with no values (129077085 bp) | 0 | 0.00% | 0 |
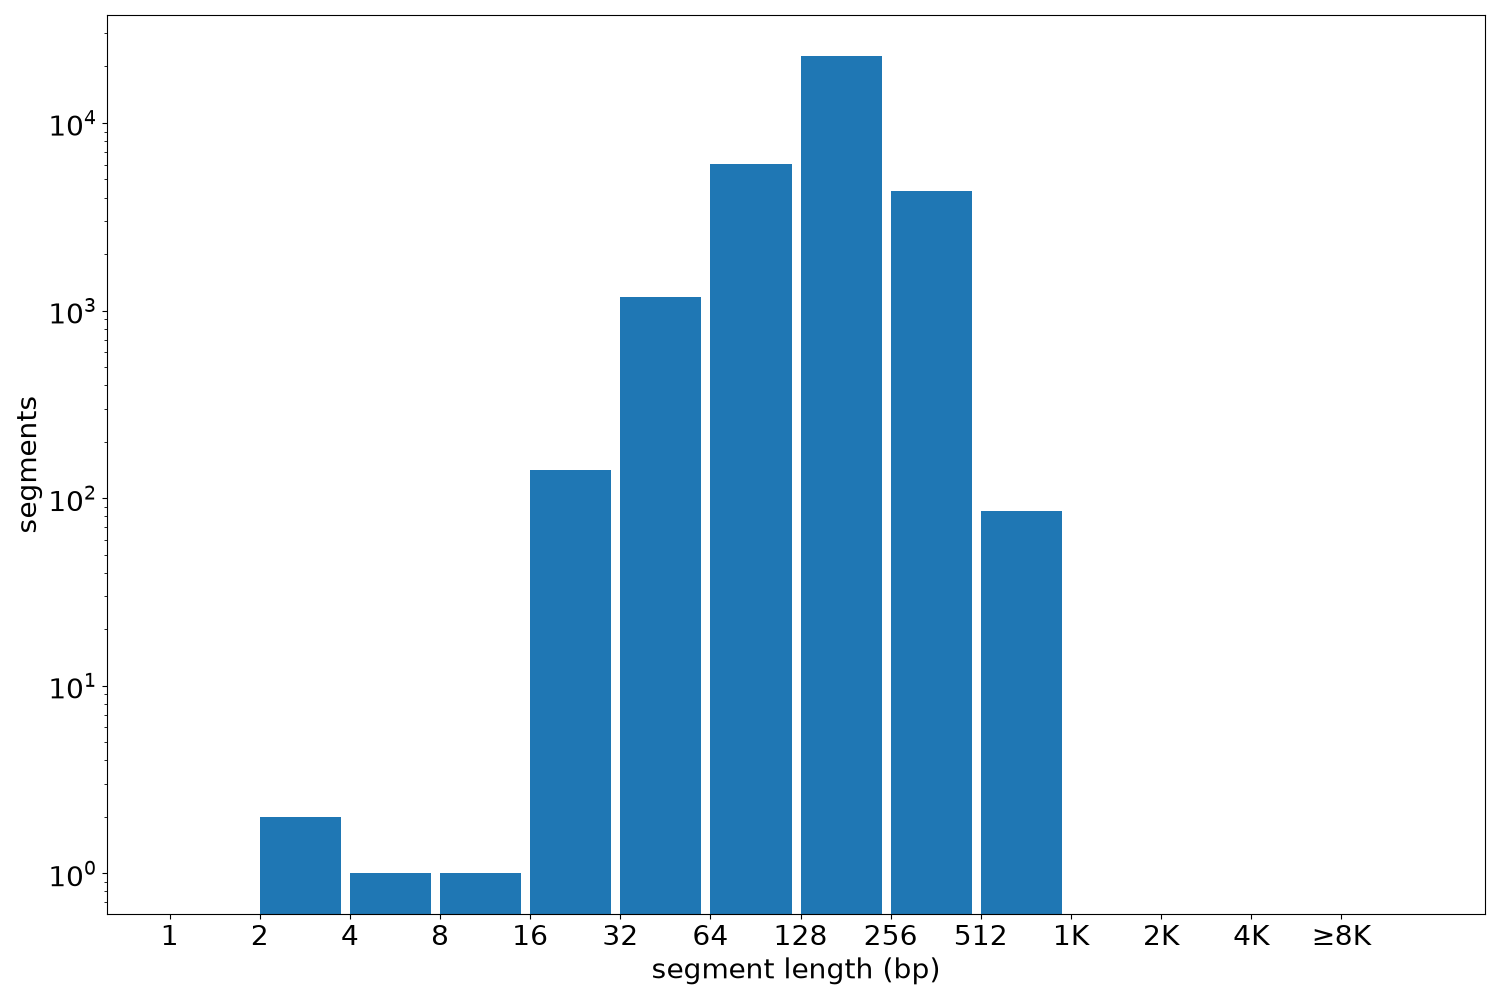
Segment lengths
| segments | min | max | mean | median | |
|---|---|---|---|---|---|
| segments | 34557 | 3 | 820 | 179.33 | 175 |
Files
| Filename | Size | md5 |
|---|---|---|
| ENCFF339ARK.bed.gz | 363.56 KB | 40065574d7c0655bc5b8d5f048635ed5 |
| ENCFF339ARK.tabix.bed.gz | 325.83 KB | ffcba9d0381bed8401e2421fbfc12668 |
| ENCFF339ARK.tabix.bed.gz.tbi | 212.16 KB | eba5e2643153921727d8d6d8af1db624 |
| genomic_resource.yaml | 2.64 KB | 4a285a3813d7c0af59bdfc524d9045db |
| statistics/ |