Resource
| Id | DNase-seq/ENCSR817ALC |
|---|---|
| Type | position_score |
| Version | 0 |
| Summary | DNase-seq ENCSR817ALC [biosample_summary="Homo sapiens mammary epithelial cell female adult (19 years)"] |
| Description |
status: released biological_replicates: Rep 1 summary: female adult (19 years) output_type: peaks audit_warning: Signal Portion of Tags (SPOT) is a measure of enrichment, analogous to the commonly used fraction of reads in peaks metric. ENCODE processed alignment files {ENCFF570RZQ|/files/ENCFF570RZQ/} processed by DNase-seq ENCODE4 v3.0.0 GRCh38 pipeline ({ENCPL848KLD|/pipelines/ENCPL848KLD/}) for GRCh38 assembly have a SPOT1 score of 0.31. According to ENCODE standards, SPOT1 score of 0.4 or higher is considered a product of high quality data. Any sample with a SPOT1 score <0.3 should be targeted for replacement with a higher quality sample, and a SPOT1 score of 0.25 is considered minimally acceptable SPOT1 score of 0.25 is considered minimally acceptable for rare and hard to find primary tissues. (See {ENCODE DNase-seq data standards|/data-standards/dnase-seq-encode4/}) |
| Labels |
|
Scores (1)
| ID | Type | Default annotation | Description | Histogram | Range | Summary |
|---|---|---|---|---|---|---|
| DNase-seq_ENCSR817ALC | float |
DNase-seq_ENCSR817ALC |
DNase-seq ENCSR817ALC [biosample_summary="Homo sapiens mammary epithelial cell female adult (19 years)"]
|
 |
[0.114, 10.9] |
|
n counts base pairs; sd is the population standard deviation.
Coverage
| Chromosome | Covered positions | Covered % | Segments |
|---|---|---|---|
| all chromosomes | 9260830 | 0.29% | 43372 |
| chr1 | 978875 | 0.39% | 4407 |
| chr2 | 674668 | 0.28% | 3226 |
| chr3 | 557750 | 0.28% | 2587 |
| chr4 | 368522 | 0.19% | 1681 |
| chr5 | 456471 | 0.25% | 2136 |
| chr6 | 527205 | 0.31% | 2466 |
| chr7 | 429111 | 0.27% | 2044 |
| chr8 | 368794 | 0.25% | 1827 |
| chr9 | 387078 | 0.28% | 1844 |
| chr10 | 414689 | 0.31% | 2001 |
| chr11 | 503176 | 0.37% | 2393 |
| chr12 | 473720 | 0.36% | 2180 |
| chr13 | 170719 | 0.15% | 788 |
| chr14 | 309462 | 0.29% | 1413 |
| chr15 | 302138 | 0.30% | 1444 |
| chr16 | 374799 | 0.41% | 1744 |
| chr17 | 518233 | 0.62% | 2372 |
| chr18 | 159765 | 0.20% | 769 |
| chr19 | 525469 | 0.90% | 2312 |
| chr20 | 257877 | 0.40% | 1266 |
| chr21 | 101095 | 0.22% | 496 |
| chr22 | 209457 | 0.41% | 1014 |
| chrX | 191637 | 0.12% | 961 |
| chrY | 120 | <0.01% | 1 |
| 3342 contigs with no values (129077085 bp) | 0 | 0.00% | 0 |
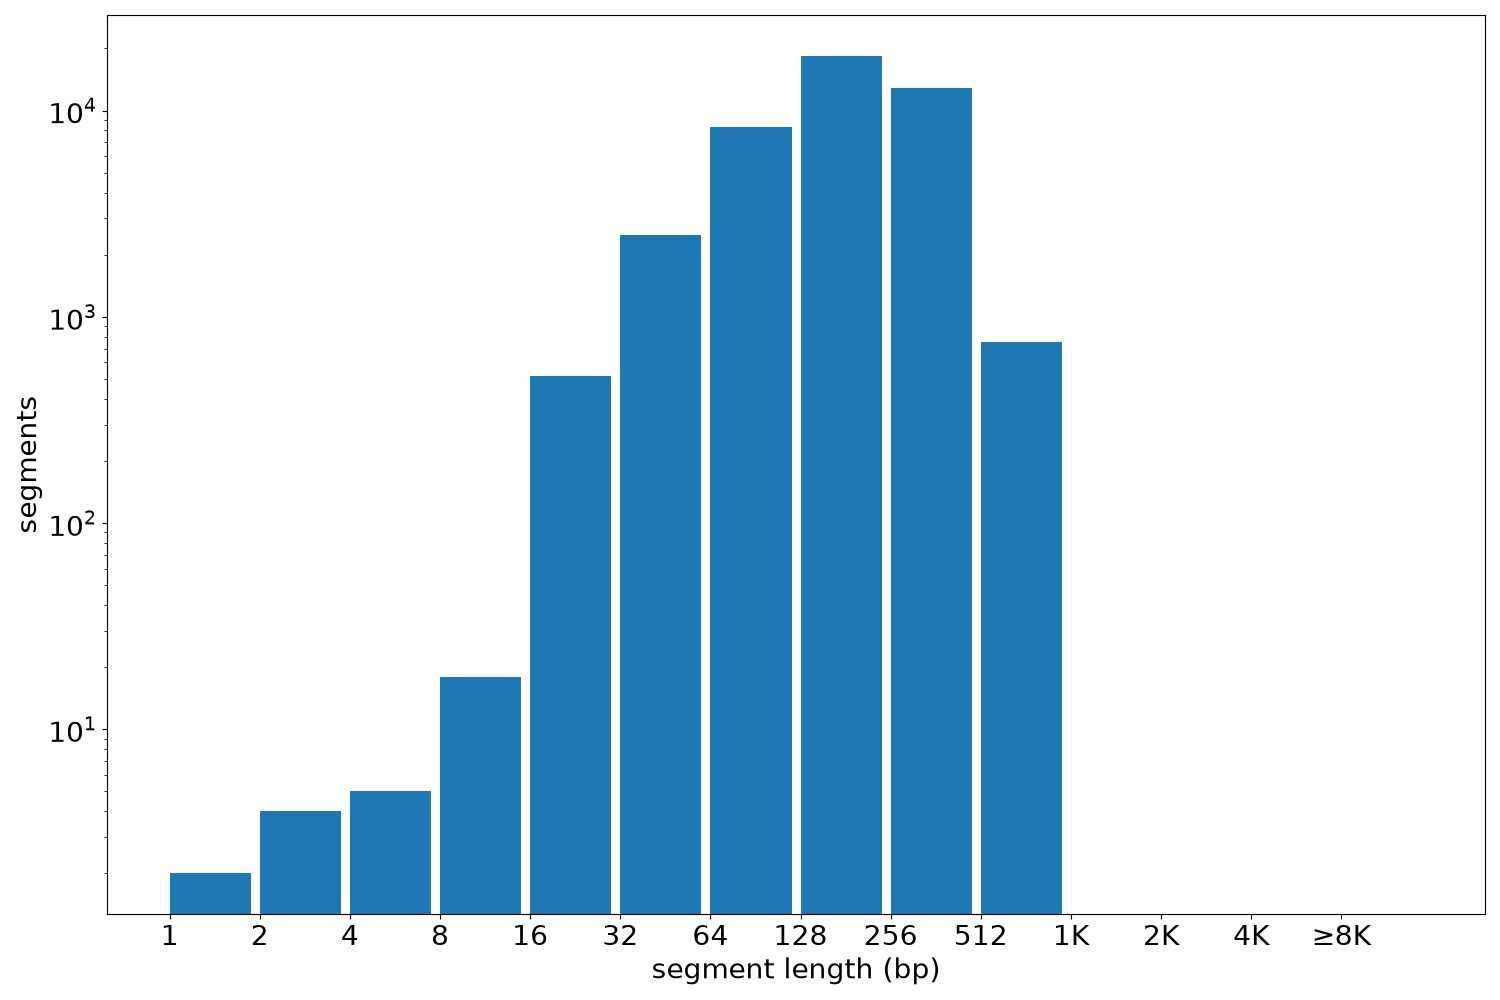
Segment lengths
| segments | min | max | mean | median | |
|---|---|---|---|---|---|
| segments | 43372 | 1 | 980 | 213.52 | 200 |
Files
| Filename | Size | md5 |
|---|---|---|
| ENCFF687TIG.bed.gz | 463.17 KB | 892d34357e5268cb5af8caf1f3c472a5 |
| ENCFF687TIG.tabix.bed.gz | 425.79 KB | 44f620dbbc2caf5c43ffb19d0e9953fe |
| ENCFF687TIG.tabix.bed.gz.tbi | 220.87 KB | 5a8172bb9ad9dde9acc70549506f5877 |
| genomic_resource.yaml | 2.05 KB | a6db97728b1d9f2b6820053735a4fa53 |
| statistics/ |