Resource
| Id | DNase-seq/ENCSR739VKY |
|---|---|
| Type | position_score |
| Version | 0 |
| Summary | DNase-seq ENCSR739VKY [biosample_summary="Homo sapiens naive B cell female adult (39 years)"] |
| Description |
status: released biological_replicates: Rep 1 summary: female adult (39 years) output_type: peaks audit_warning: Signal Portion of Tags (SPOT) is a measure of enrichment, analogous to the commonly used fraction of reads in peaks metric. ENCODE processed alignment files {ENCFF840FIU|/files/ENCFF840FIU/} processed by DNase-seq ENCODE4 v3.0.0 GRCh38 pipeline ({ENCPL848KLD|/pipelines/ENCPL848KLD/}) for GRCh38 assembly have a SPOT1 score of 0.33. According to ENCODE standards, SPOT1 score of 0.4 or higher is considered a product of high quality data. Any sample with a SPOT1 score <0.3 should be targeted for replacement with a higher quality sample, and a SPOT1 score of 0.25 is considered minimally acceptable SPOT1 score of 0.25 is considered minimally acceptable for rare and hard to find primary tissues. (See {ENCODE DNase-seq data standards|/data-standards/dnase-seq-encode4/}) |
| Labels |
|
Scores (1)
| ID | Type | Default annotation | Description | Histogram | Range | Summary |
|---|---|---|---|---|---|---|
| DNase-seq_ENCSR739VKY | float |
DNase-seq_ENCSR739VKY |
DNase-seq ENCSR739VKY [biosample_summary="Homo sapiens naive B cell female adult (39 years)"]
|
 |
[0.0945, 28.7] |
|
n counts base pairs; sd is the population standard deviation.
Coverage
| Chromosome | Covered positions | Covered % | Segments |
|---|---|---|---|
| all chromosomes | 11855270 | 0.37% | 59091 |
| chr1 | 1157522 | 0.46% | 5750 |
| chr2 | 861530 | 0.36% | 4290 |
| chr3 | 662792 | 0.33% | 3328 |
| chr4 | 460925 | 0.24% | 2355 |
| chr5 | 556930 | 0.31% | 2791 |
| chr6 | 735826 | 0.43% | 3636 |
| chr7 | 575540 | 0.36% | 2888 |
| chr8 | 467005 | 0.32% | 2365 |
| chr9 | 467190 | 0.34% | 2362 |
| chr10 | 518038 | 0.39% | 2584 |
| chr11 | 587105 | 0.43% | 2946 |
| chr12 | 624204 | 0.47% | 3096 |
| chr13 | 235858 | 0.21% | 1183 |
| chr14 | 412201 | 0.39% | 2029 |
| chr15 | 376624 | 0.37% | 1885 |
| chr16 | 469195 | 0.52% | 2335 |
| chr17 | 664846 | 0.80% | 3278 |
| chr18 | 218288 | 0.27% | 1088 |
| chr19 | 723466 | 1.23% | 3448 |
| chr20 | 311700 | 0.48% | 1589 |
| chr21 | 131478 | 0.28% | 668 |
| chr22 | 284962 | 0.56% | 1431 |
| chrX | 351785 | 0.23% | 1764 |
| chrY | 260 | <0.01% | 2 |
| 3342 contigs with no values (129077085 bp) | 0 | 0.00% | 0 |
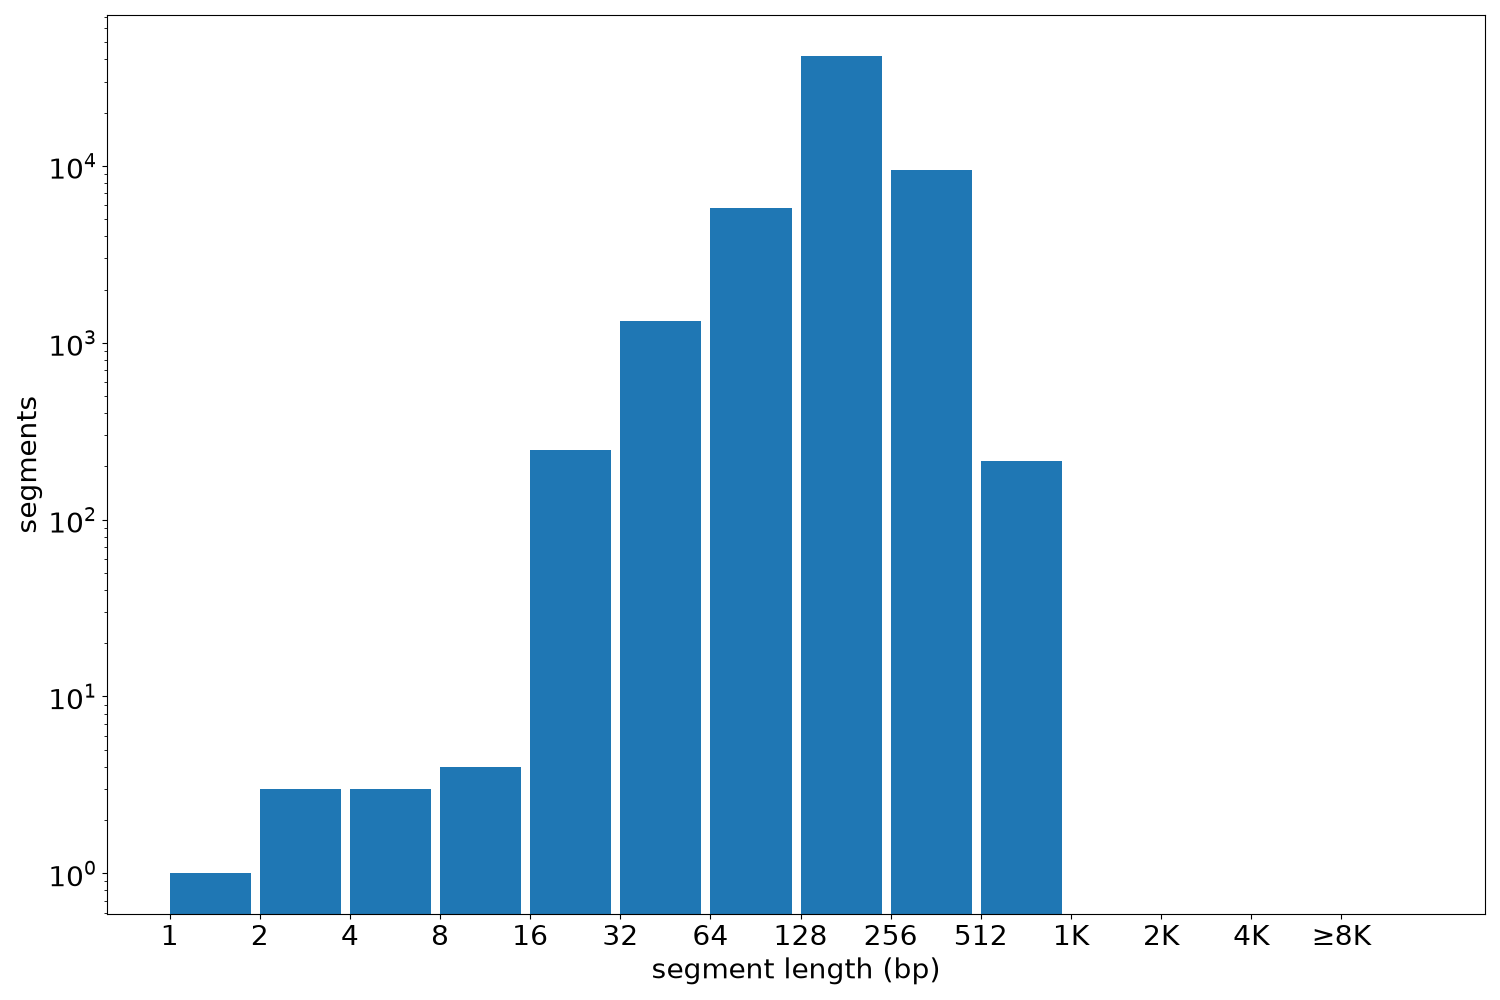
Segment lengths
| segments | min | max | mean | median | |
|---|---|---|---|---|---|
| segments | 59091 | 1 | 960 | 200.63 | 200 |
Files
| Filename | Size | md5 |
|---|---|---|
| ENCFF642YJJ.bed.gz | 656.7 KB | 48721f3d9ae5257ffe4acc4cdb600cad |
| ENCFF642YJJ.tabix.bed.gz | 601.68 KB | 3d618dbd1de9cfd6350ec628f892b4f3 |
| ENCFF642YJJ.tabix.bed.gz.tbi | 266.19 KB | 11de95ebd55dc68bc0fcd048b1ce355e |
| genomic_resource.yaml | 2.02 KB | ff63d45de9800627af13da780ad528e0 |
| statistics/ |