Resource
| Id | DNase-seq/ENCSR728BAD |
|---|---|
| Type | position_score |
| Version | 0 |
| Summary | DNase-seq ENCSR728BAD [biosample_summary="Homo sapiens adrenal gland tissue male embryo (108 days)"] |
| Description |
status: released biological_replicates: Rep 1 summary: male embryo (108 days) output_type: peaks audit_warning: Alignment file {ENCFF982YMU|/files/ENCFF982YMU/} processed by DNase-seq ENCODE4 v3.0.0-alpha.2 GRCh38 pipeline ( {ENCPL848KLD|/pipelines/ENCPL848KLD/} ) for GRCh38 assembly has 28285867 mapped reads. According to ENCODE standards, conventional DNase-seq profile requires a minimum of 20 million uniquely mapped reads to generate a reliable SPOT (Signal Portion of Tags) score. The recommended value is > 50 million. For deep, foot-printing depth DNase-seq 150-200 million uniquely mapped reads are recommended. (See {ENCODE DNase-seq data standards|/data-standards/dnase-seq-encode4/}) audit_warning: Signal Portion of Tags (SPOT) is a measure of enrichment, analogous to the commonly used fraction of reads in peaks metric. ENCODE processed alignment files {ENCFF982YMU|/files/ENCFF982YMU/} processed by DNase-seq ENCODE4 v3.0.0-alpha.2 GRCh38 pipeline ({ENCPL848KLD|/pipelines/ENCPL848KLD/}) for GRCh38 assembly have a SPOT1 score of 0.30. According to ENCODE standards, SPOT1 score of 0.4 or higher is considered a product of high quality data. Any sample with a SPOT1 score <0.3 should be targeted for replacement with a higher quality sample, and a SPOT1 score of 0.25 is considered minimally acceptable SPOT1 score of 0.25 is considered minimally acceptable for rare and hard to find primary tissues. (See {ENCODE DNase-seq data standards|/data-standards/dnase-seq-encode4/}) |
| Labels |
|
Scores (1)
| ID | Type | Default annotation | Description | Histogram | Range | Summary |
|---|---|---|---|---|---|---|
| DNase-seq_ENCSR728BAD | float |
DNase-seq_ENCSR728BAD |
DNase-seq ENCSR728BAD [biosample_summary="Homo sapiens adrenal gland tissue male embryo (108 days)"]
|
 |
[0.284, 12.4] |
|
n counts base pairs; sd is the population standard deviation.
Coverage
| Chromosome | Covered positions | Covered % | Segments |
|---|---|---|---|
| all chromosomes | 8153171 | 0.25% | 45089 |
| chr1 | 763467 | 0.31% | 4188 |
| chr2 | 629565 | 0.26% | 3520 |
| chr3 | 519315 | 0.26% | 2903 |
| chr4 | 383173 | 0.20% | 2106 |
| chr5 | 418827 | 0.23% | 2357 |
| chr6 | 465969 | 0.27% | 2561 |
| chr7 | 417935 | 0.26% | 2342 |
| chr8 | 352999 | 0.24% | 1968 |
| chr9 | 339739 | 0.25% | 1896 |
| chr10 | 388209 | 0.29% | 2185 |
| chr11 | 435937 | 0.32% | 2383 |
| chr12 | 410425 | 0.31% | 2282 |
| chr13 | 214745 | 0.19% | 1197 |
| chr14 | 280099 | 0.26% | 1512 |
| chr15 | 267757 | 0.26% | 1490 |
| chr16 | 281293 | 0.31% | 1552 |
| chr17 | 362298 | 0.44% | 1996 |
| chr18 | 171811 | 0.21% | 968 |
| chr19 | 407752 | 0.70% | 2083 |
| chr20 | 205765 | 0.32% | 1170 |
| chr21 | 92733 | 0.20% | 505 |
| chr22 | 155523 | 0.31% | 857 |
| chrX | 181117 | 0.12% | 1027 |
| chrY | 6718 | 0.01% | 41 |
| 3342 contigs with no values (129077085 bp) | 0 | 0.00% | 0 |
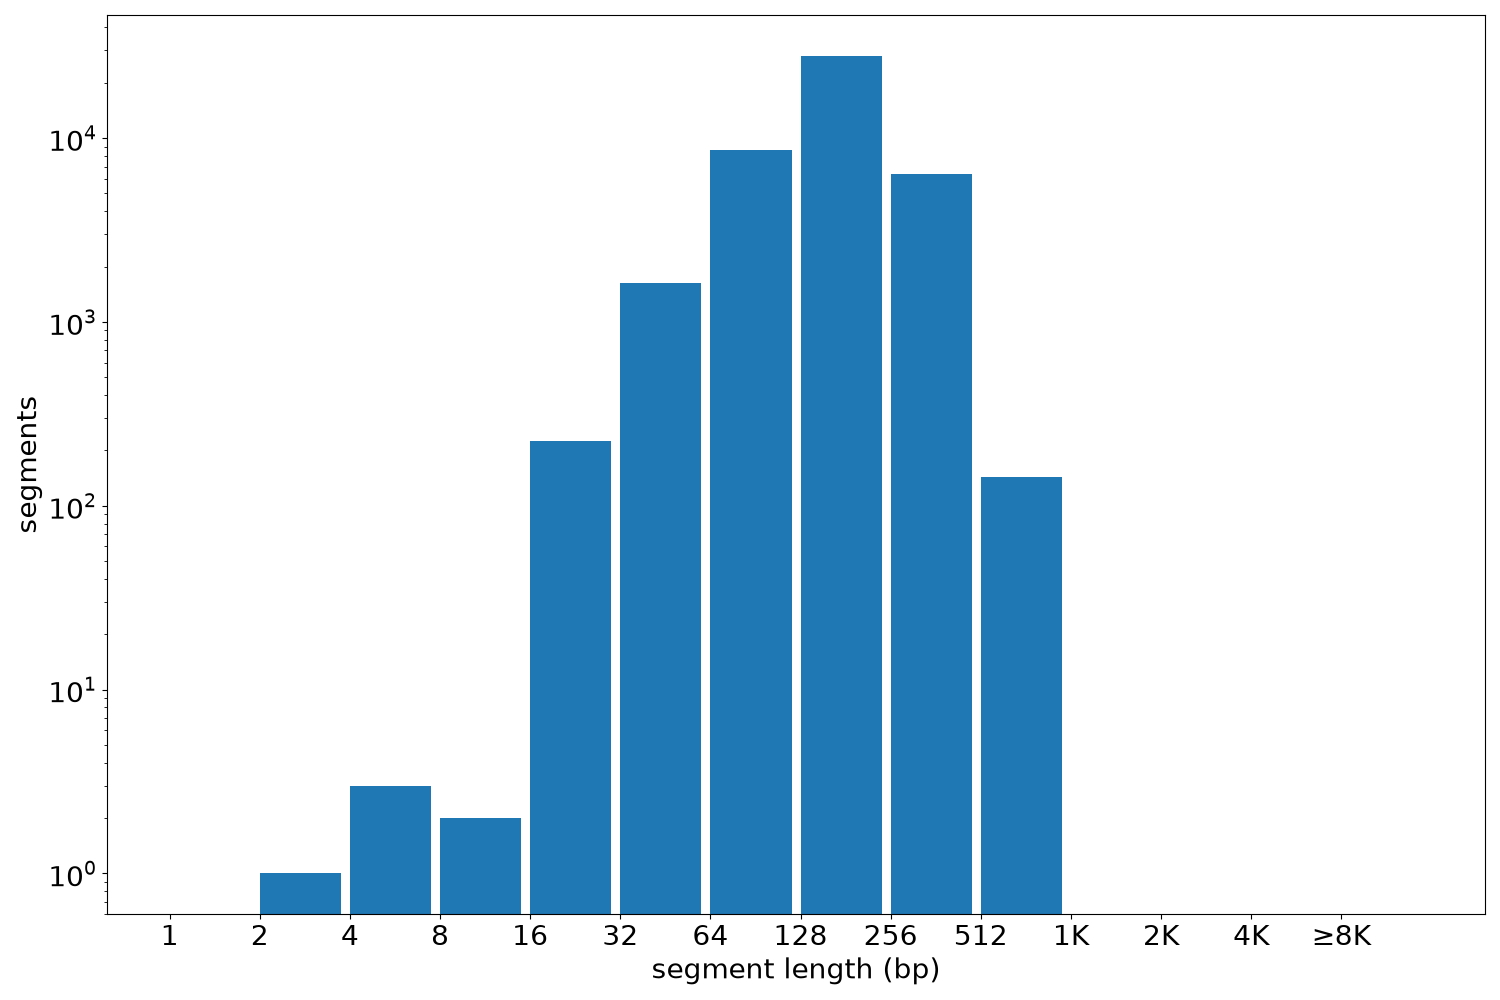
Segment lengths
| segments | min | max | mean | median | |
|---|---|---|---|---|---|
| segments | 45089 | 3 | 760 | 180.82 | 177 |
Files
| Filename | Size | md5 |
|---|---|---|
| ENCFF659HIW.bed.gz | 470.06 KB | ff37527b57d03561e5d4be030a102962 |
| ENCFF659HIW.tabix.bed.gz | 419.69 KB | f55ad56bfd920b5a82f34bcc4734cac9 |
| ENCFF659HIW.tabix.bed.gz.tbi | 263.87 KB | e83a5b449cfdf475fd6faba9f78541d9 |
| genomic_resource.yaml | 2.66 KB | ae5dc80e677eff0dd9d4f55de97f35a0 |
| statistics/ |