Resource
| Id | DNase-seq/ENCSR694DOX |
|---|---|
| Type | position_score |
| Version | 0 |
| Summary | DNase-seq ENCSR694DOX [biosample_summary="Homo sapiens posterior cingulate gyrus tissue male adult (83 years)"] |
| Description |
status: released biological_replicates: Rep 1 summary: male adult (83 years) output_type: peaks audit_warning: Signal Portion of Tags (SPOT) is a measure of enrichment, analogous to the commonly used fraction of reads in peaks metric. ENCODE processed alignment files {ENCFF515ADG|/files/ENCFF515ADG/} processed by DNase-seq ENCODE4 v3.0.0-alpha.2 GRCh38 pipeline ({ENCPL848KLD|/pipelines/ENCPL848KLD/}) for GRCh38 assembly have a SPOT1 score of 0.39. According to ENCODE standards, SPOT1 score of 0.4 or higher is considered a product of high quality data. Any sample with a SPOT1 score <0.3 should be targeted for replacement with a higher quality sample, and a SPOT1 score of 0.25 is considered minimally acceptable SPOT1 score of 0.25 is considered minimally acceptable for rare and hard to find primary tissues. (See {ENCODE DNase-seq data standards|/data-standards/dnase-seq-encode4/}) |
| Labels |
|
Scores (1)
| ID | Type | Default annotation | Description | Histogram | Range | Summary |
|---|---|---|---|---|---|---|
| DNase-seq_ENCSR694DOX | float |
DNase-seq_ENCSR694DOX |
DNase-seq ENCSR694DOX [biosample_summary="Homo sapiens posterior cingulate gyrus tissue male adult (83 years)"]
|
 |
[0.119, 18.8] |
|
n counts base pairs; sd is the population standard deviation.
Coverage
| Chromosome | Covered positions | Covered % | Segments |
|---|---|---|---|
| all chromosomes | 7943917 | 0.25% | 43241 |
| chr1 | 771150 | 0.31% | 4217 |
| chr2 | 565768 | 0.23% | 3133 |
| chr3 | 450015 | 0.23% | 2451 |
| chr4 | 314410 | 0.17% | 1671 |
| chr5 | 377950 | 0.21% | 2068 |
| chr6 | 408788 | 0.24% | 2203 |
| chr7 | 377005 | 0.24% | 2075 |
| chr8 | 363107 | 0.25% | 2013 |
| chr9 | 337831 | 0.24% | 1851 |
| chr10 | 348483 | 0.26% | 1922 |
| chr11 | 460021 | 0.34% | 2532 |
| chr12 | 387806 | 0.29% | 2076 |
| chr13 | 152968 | 0.13% | 836 |
| chr14 | 272117 | 0.25% | 1479 |
| chr15 | 270953 | 0.27% | 1487 |
| chr16 | 314976 | 0.35% | 1690 |
| chr17 | 428049 | 0.51% | 2315 |
| chr18 | 138952 | 0.17% | 769 |
| chr19 | 473152 | 0.81% | 2439 |
| chr20 | 236252 | 0.37% | 1319 |
| chr21 | 95676 | 0.20% | 541 |
| chr22 | 192311 | 0.38% | 1031 |
| chrX | 198868 | 0.13% | 1081 |
| chrY | 7309 | 0.01% | 42 |
| 3342 contigs with no values (129077085 bp) | 0 | 0.00% | 0 |
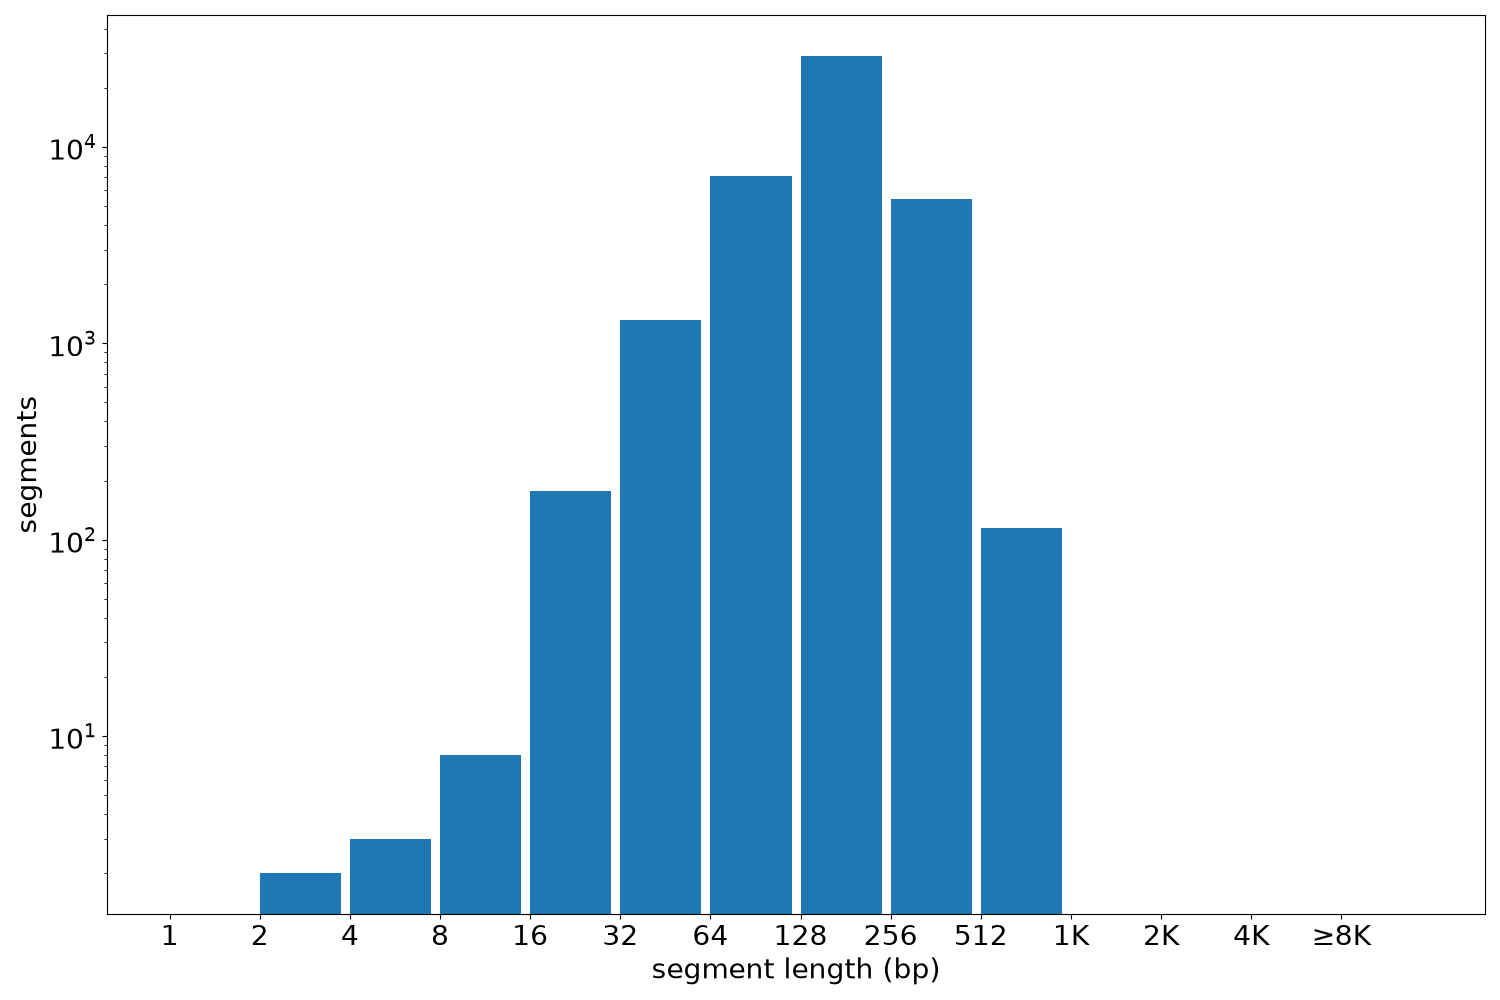
Segment lengths
| segments | min | max | mean | median | |
|---|---|---|---|---|---|
| segments | 43241 | 2 | 814 | 183.71 | 180 |
Files
| Filename | Size | md5 |
|---|---|---|
| ENCFF099FUV.bed.gz | 479.59 KB | 4ca7955b4caddc2292e9564852eb927a |
| ENCFF099FUV.tabix.bed.gz | 433.37 KB | 8f3ff23d5c142bbca587010580a0bc2d |
| ENCFF099FUV.tabix.bed.gz.tbi | 225.09 KB | 998fdad9b1e06772302dd5baf765d7b8 |
| genomic_resource.yaml | 2.08 KB | b72c38469f1d261a2e70beaa4c085720 |
| statistics/ |