Resource
| Id | DNase-seq/ENCSR670MKJ |
|---|---|
| Type | position_score |
| Version | 0 |
| Summary | DNase-seq ENCSR670MKJ [biosample_summary="Homo sapiens posterior cingulate gyrus tissue female adult (89 years)"] |
| Description |
status: released biological_replicates: Rep 1 summary: female adult (89 years) output_type: peaks audit_warning: Signal Portion of Tags (SPOT) is a measure of enrichment, analogous to the commonly used fraction of reads in peaks metric. ENCODE processed alignment files {ENCFF366PMV|/files/ENCFF366PMV/} processed by DNase-seq ENCODE4 v3.0.0-alpha.2 GRCh38 pipeline ({ENCPL848KLD|/pipelines/ENCPL848KLD/}) for GRCh38 assembly have a SPOT1 score of 0.34. According to ENCODE standards, SPOT1 score of 0.4 or higher is considered a product of high quality data. Any sample with a SPOT1 score <0.3 should be targeted for replacement with a higher quality sample, and a SPOT1 score of 0.25 is considered minimally acceptable SPOT1 score of 0.25 is considered minimally acceptable for rare and hard to find primary tissues. (See {ENCODE DNase-seq data standards|/data-standards/dnase-seq-encode4/}) |
| Labels |
|
Scores (1)
| ID | Type | Default annotation | Description | Histogram | Range | Summary |
|---|---|---|---|---|---|---|
| DNase-seq_ENCSR670MKJ | float |
DNase-seq_ENCSR670MKJ |
DNase-seq ENCSR670MKJ [biosample_summary="Homo sapiens posterior cingulate gyrus tissue female adult (89 years)"]
|
 |
[0.0691, 13.3] |
|
n counts base pairs; sd is the population standard deviation.
Coverage
| Chromosome | Covered positions | Covered % | Segments |
|---|---|---|---|
| all chromosomes | 16133612 | 0.50% | 80308 |
| chr1 | 1348742 | 0.54% | 6727 |
| chr2 | 1340564 | 0.55% | 6619 |
| chr3 | 754998 | 0.38% | 3801 |
| chr4 | 616381 | 0.32% | 2988 |
| chr5 | 644964 | 0.36% | 3256 |
| chr6 | 438898 | 0.26% | 2282 |
| chr7 | 943070 | 0.59% | 4649 |
| chr8 | 730862 | 0.50% | 3517 |
| chr9 | 746189 | 0.54% | 3730 |
| chr10 | 910855 | 0.68% | 4545 |
| chr11 | 1139929 | 0.84% | 5598 |
| chr12 | 591910 | 0.44% | 3009 |
| chr13 | 238065 | 0.21% | 1212 |
| chr14 | 540895 | 0.51% | 2711 |
| chr15 | 548737 | 0.54% | 2756 |
| chr16 | 751653 | 0.83% | 3813 |
| chr17 | 1006093 | 1.21% | 5067 |
| chr18 | 244577 | 0.30% | 1211 |
| chr19 | 627372 | 1.07% | 3136 |
| chr20 | 548546 | 0.85% | 2747 |
| chr21 | 331723 | 0.71% | 1578 |
| chr22 | 795765 | 1.57% | 3799 |
| chrX | 291261 | 0.19% | 1544 |
| chrY | 1563 | <0.01% | 13 |
| 3342 contigs with no values (129077085 bp) | 0 | 0.00% | 0 |
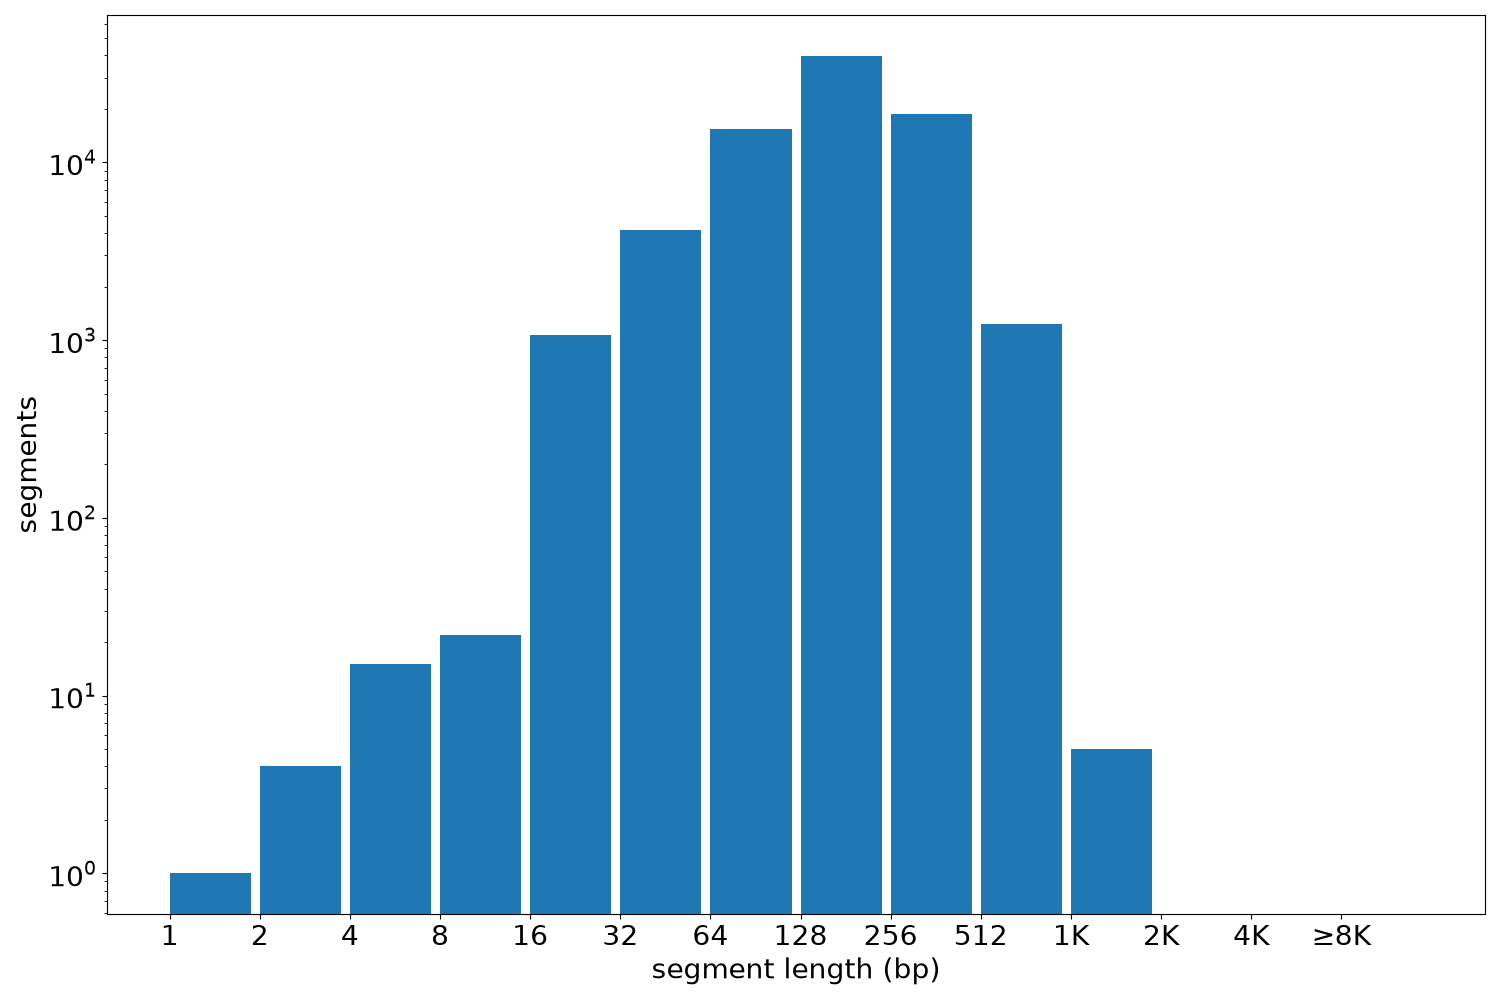
Segment lengths
| segments | min | max | mean | median | |
|---|---|---|---|---|---|
| segments | 80308 | 1 | 1640 | 200.9 | 187 |
Files
| Filename | Size | md5 |
|---|---|---|
| ENCFF887QIZ.bed.gz | 791.78 KB | a111c484d8167a8481eba25279847d5e |
| ENCFF887QIZ.tabix.bed.gz | 744.34 KB | 8daf85cbf584118def38996986f255b3 |
| ENCFF887QIZ.tabix.bed.gz.tbi | 178.82 KB | 0eb68bebbe12ec56581adbcd93eba202 |
| genomic_resource.yaml | 2.09 KB | 1bd787f67c3426b6f48c4fd05f11b088 |
| statistics/ |