Resource
| Id | DNase-seq/ENCSR658EHM |
|---|---|
| Type | position_score |
| Version | 0 |
| Summary | DNase-seq ENCSR658EHM [biosample_summary="Homo sapiens mesothelial cell of epicardium"] |
| Description |
status: released biological_replicates: Rep 1 summary: female embryo (5 days) output_type: peaks audit_warning: Signal Portion of Tags (SPOT) is a measure of enrichment, analogous to the commonly used fraction of reads in peaks metric. ENCODE processed alignment files {ENCFF139MJE|/files/ENCFF139MJE/} processed by DNase-seq ENCODE4 v3.0.0 GRCh38 pipeline ({ENCPL848KLD|/pipelines/ENCPL848KLD/}) for GRCh38 assembly have a SPOT1 score of 0.33. According to ENCODE standards, SPOT1 score of 0.4 or higher is considered a product of high quality data. Any sample with a SPOT1 score <0.3 should be targeted for replacement with a higher quality sample, and a SPOT1 score of 0.25 is considered minimally acceptable SPOT1 score of 0.25 is considered minimally acceptable for rare and hard to find primary tissues. (See {ENCODE DNase-seq data standards|/data-standards/dnase-seq-encode4/}) |
| Labels |
|
Scores (1)
| ID | Type | Default annotation | Description | Histogram | Range | Summary |
|---|---|---|---|---|---|---|
| DNase-seq_ENCSR658EHM | float |
DNase-seq_ENCSR658EHM |
DNase-seq ENCSR658EHM [biosample_summary="Homo sapiens mesothelial cell of epicardium"]
|
 |
[0.0558, 17.8] |
|
n counts base pairs; sd is the population standard deviation.
Coverage
| Chromosome | Covered positions | Covered % | Segments |
|---|---|---|---|
| all chromosomes | 18174473 | 0.56% | 86673 |
| chr1 | 1739675 | 0.70% | 8099 |
| chr2 | 1553381 | 0.64% | 7449 |
| chr3 | 980700 | 0.49% | 4630 |
| chr4 | 623894 | 0.33% | 2863 |
| chr5 | 931190 | 0.51% | 4411 |
| chr6 | 936217 | 0.55% | 4383 |
| chr7 | 891861 | 0.56% | 4229 |
| chr8 | 771622 | 0.53% | 3716 |
| chr9 | 823037 | 0.59% | 3962 |
| chr10 | 1010808 | 0.76% | 4856 |
| chr11 | 1042627 | 0.77% | 5016 |
| chr12 | 700052 | 0.53% | 3301 |
| chr13 | 329168 | 0.29% | 1579 |
| chr14 | 636637 | 0.59% | 3022 |
| chr15 | 694973 | 0.68% | 3400 |
| chr16 | 677225 | 0.75% | 3336 |
| chr17 | 931593 | 1.12% | 4457 |
| chr18 | 368586 | 0.46% | 1806 |
| chr19 | 812033 | 1.39% | 3794 |
| chr20 | 531997 | 0.83% | 2656 |
| chr21 | 279543 | 0.60% | 1320 |
| chr22 | 483263 | 0.95% | 2355 |
| chrX | 423801 | 0.27% | 2028 |
| chrY | 590 | <0.01% | 5 |
| 3342 contigs with no values (129077085 bp) | 0 | 0.00% | 0 |
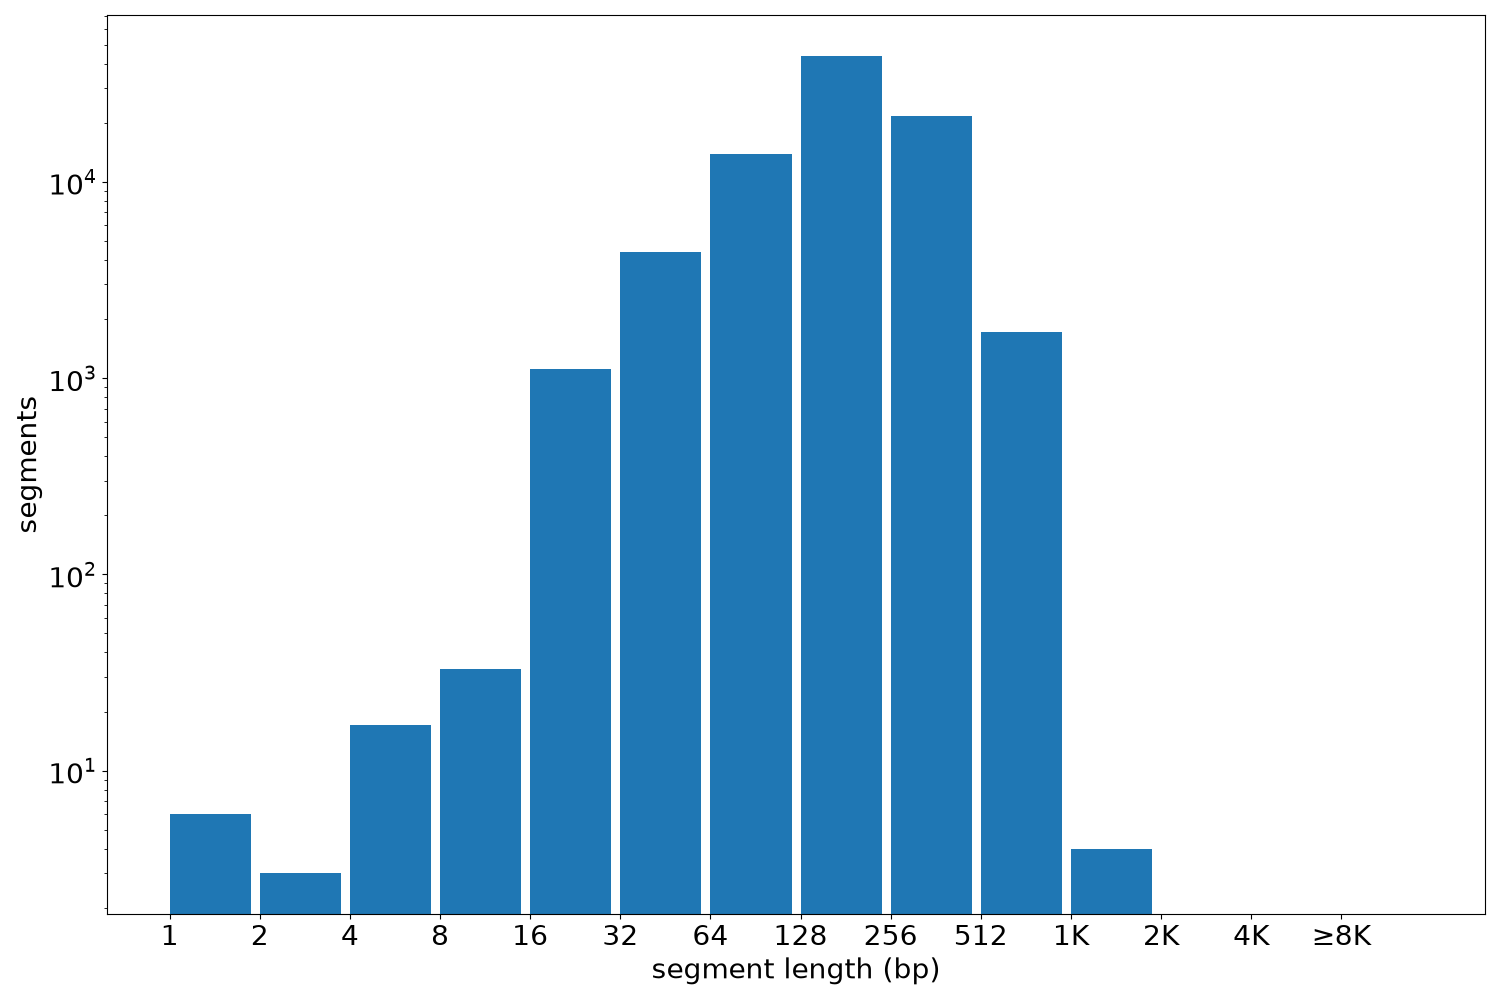
Segment lengths
| segments | min | max | mean | median | |
|---|---|---|---|---|---|
| segments | 86673 | 1 | 1204 | 209.69 | 200 |
Files
| Filename | Size | md5 |
|---|---|---|
| ENCFF291PBQ.bed.gz | 900.27 KB | 6852f4239db2fa643ae0920085bc091b |
| ENCFF291PBQ.tabix.bed.gz | 843.44 KB | a6013432ef699e463fdd66c135ac1e2b |
| ENCFF291PBQ.tabix.bed.gz.tbi | 265.05 KB | 7d51c6f9dc4ce1a34487cd3b8f87f8c0 |
| genomic_resource.yaml | 2.01 KB | 298701da3be311e62b0d5cae068dbd78 |
| statistics/ |