Resource
| Id | DNase-seq/ENCSR645GJD |
|---|---|
| Type | position_score |
| Version | 0 |
| Summary | DNase-seq ENCSR645GJD [biosample_summary="Homo sapiens kidney tissue female embryo (113 days)"] |
| Description |
status: released biological_replicates: Rep 1 summary: female embryo (113 days) output_type: peaks audit_warning: Signal Portion of Tags (SPOT) is a measure of enrichment, analogous to the commonly used fraction of reads in peaks metric. ENCODE processed alignment files {ENCFF544EKH|/files/ENCFF544EKH/} processed by DNase-seq ENCODE4 v3.0.0-alpha.2 GRCh38 pipeline ({ENCPL848KLD|/pipelines/ENCPL848KLD/}) for GRCh38 assembly have a SPOT1 score of 0.39. According to ENCODE standards, SPOT1 score of 0.4 or higher is considered a product of high quality data. Any sample with a SPOT1 score <0.3 should be targeted for replacement with a higher quality sample, and a SPOT1 score of 0.25 is considered minimally acceptable SPOT1 score of 0.25 is considered minimally acceptable for rare and hard to find primary tissues. (See {ENCODE DNase-seq data standards|/data-standards/dnase-seq-encode4/}) |
| Labels |
|
Scores (1)
| ID | Type | Default annotation | Description | Histogram | Range | Summary |
|---|---|---|---|---|---|---|
| DNase-seq_ENCSR645GJD | float |
DNase-seq_ENCSR645GJD |
DNase-seq ENCSR645GJD [biosample_summary="Homo sapiens kidney tissue female embryo (113 days)"]
|
 |
[0.121, 18.3] |
|
n counts base pairs; sd is the population standard deviation.
Coverage
| Chromosome | Covered positions | Covered % | Segments |
|---|---|---|---|
| all chromosomes | 16070526 | 0.50% | 80432 |
| chr1 | 1448662 | 0.58% | 7259 |
| chr2 | 1267248 | 0.52% | 6301 |
| chr3 | 1055550 | 0.53% | 5246 |
| chr4 | 816351 | 0.43% | 4127 |
| chr5 | 884833 | 0.49% | 4426 |
| chr6 | 973712 | 0.57% | 4813 |
| chr7 | 829544 | 0.52% | 4170 |
| chr8 | 717127 | 0.49% | 3626 |
| chr9 | 675346 | 0.49% | 3367 |
| chr10 | 786750 | 0.59% | 3970 |
| chr11 | 824286 | 0.61% | 4089 |
| chr12 | 809953 | 0.61% | 4007 |
| chr13 | 428220 | 0.37% | 2167 |
| chr14 | 526518 | 0.49% | 2608 |
| chr15 | 534675 | 0.52% | 2682 |
| chr16 | 511767 | 0.57% | 2641 |
| chr17 | 656250 | 0.79% | 3267 |
| chr18 | 373244 | 0.46% | 1901 |
| chr19 | 629645 | 1.07% | 3028 |
| chr20 | 411298 | 0.64% | 2117 |
| chr21 | 170477 | 0.36% | 852 |
| chr22 | 276789 | 0.54% | 1422 |
| chrX | 462016 | 0.30% | 2344 |
| chrY | 265 | <0.01% | 2 |
| 3342 contigs with no values (129077085 bp) | 0 | 0.00% | 0 |
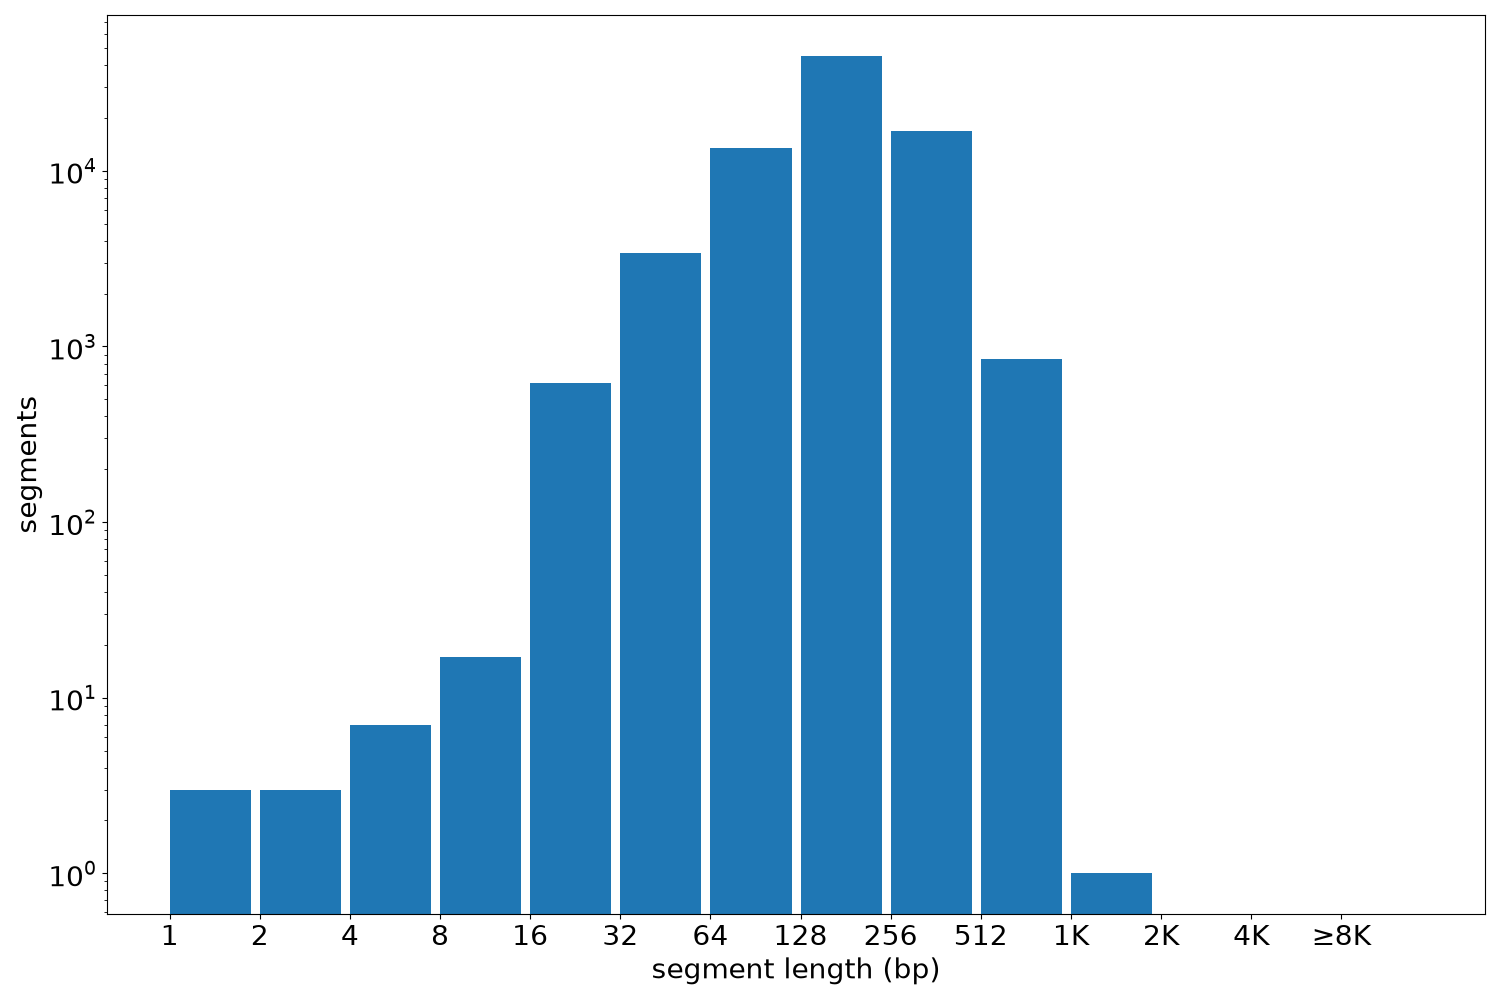
Segment lengths
| segments | min | max | mean | median | |
|---|---|---|---|---|---|
| segments | 80432 | 1 | 1080 | 199.8 | 194 |
Files
| Filename | Size | md5 |
|---|---|---|
| ENCFF931HGM.bed.gz | 845.87 KB | 02b03c2ad218eaf9344c7979ba959635 |
| ENCFF931HGM.tabix.bed.gz | 769.7 KB | b6aedc209bb12be22e827096a8adc10f |
| ENCFF931HGM.tabix.bed.gz.tbi | 387.32 KB | 787e8f4947f7348c9554d287becd0274 |
| genomic_resource.yaml | 2.03 KB | 65073c4a27f264b0f11f201e37e12390 |
| statistics/ |