Resource
| Id | DNase-seq/ENCSR593LTJ |
|---|---|
| Type | position_score |
| Version | 0 |
| Summary | DNase-seq ENCSR593LTJ [biosample_summary="Homo sapiens trophoblast cell embryo (17 weeks) and embryo (18 weeks)"] |
| Description |
status: released biological_replicates: Rep 2 summary: embryo (17 weeks) embryo (18 weeks) output_type: peaks audit_warning: Signal Portion of Tags (SPOT) is a measure of enrichment, analogous to the commonly used fraction of reads in peaks metric. ENCODE processed alignment files {ENCFF610MXQ|/files/ENCFF610MXQ/} processed by DNase-seq ENCODE4 v3.0.0-alpha.2 GRCh38 pipeline ({ENCPL848KLD|/pipelines/ENCPL848KLD/}) for GRCh38 assembly have a SPOT1 score of 0.38. According to ENCODE standards, SPOT1 score of 0.4 or higher is considered a product of high quality data. Any sample with a SPOT1 score <0.3 should be targeted for replacement with a higher quality sample, and a SPOT1 score of 0.25 is considered minimally acceptable SPOT1 score of 0.25 is considered minimally acceptable for rare and hard to find primary tissues. (See {ENCODE DNase-seq data standards|/data-standards/dnase-seq-encode4/}) |
| Labels |
|
Scores (1)
| ID | Type | Default annotation | Description | Histogram | Range | Summary |
|---|---|---|---|---|---|---|
| DNase-seq_ENCSR593LTJ | float |
DNase-seq_ENCSR593LTJ |
DNase-seq ENCSR593LTJ [biosample_summary="Homo sapiens trophoblast cell embryo (17 weeks) and embryo (18 weeks)"]
|
 |
[0.0106, 11.4] |
|
n counts base pairs; sd is the population standard deviation.
Coverage
| Chromosome | Covered positions | Covered % | Segments |
|---|---|---|---|
| all chromosomes | 64495448 | 2.00% | 311324 |
| chr1 | 5999167 | 2.41% | 28913 |
| chr2 | 5256041 | 2.17% | 25408 |
| chr3 | 4358459 | 2.20% | 21020 |
| chr4 | 3405143 | 1.79% | 16474 |
| chr5 | 3725187 | 2.05% | 17866 |
| chr6 | 4117471 | 2.41% | 19754 |
| chr7 | 3436323 | 2.16% | 16608 |
| chr8 | 2942849 | 2.03% | 14110 |
| chr9 | 2747530 | 1.99% | 13312 |
| chr10 | 3018569 | 2.26% | 14614 |
| chr11 | 3092929 | 2.29% | 14969 |
| chr12 | 3141217 | 2.36% | 15152 |
| chr13 | 1755753 | 1.54% | 8448 |
| chr14 | 1960736 | 1.83% | 9397 |
| chr15 | 2072635 | 2.03% | 10054 |
| chr16 | 1819643 | 2.01% | 8828 |
| chr17 | 2503132 | 3.01% | 12090 |
| chr18 | 1437709 | 1.79% | 6969 |
| chr19 | 2103762 | 3.59% | 10070 |
| chr20 | 1552384 | 2.41% | 7528 |
| chr21 | 807655 | 1.73% | 3839 |
| chr22 | 1092179 | 2.15% | 5286 |
| chrX | 1987172 | 1.27% | 9787 |
| chrY | 161803 | 0.28% | 828 |
| 3342 contigs with no values (129077085 bp) | 0 | 0.00% | 0 |
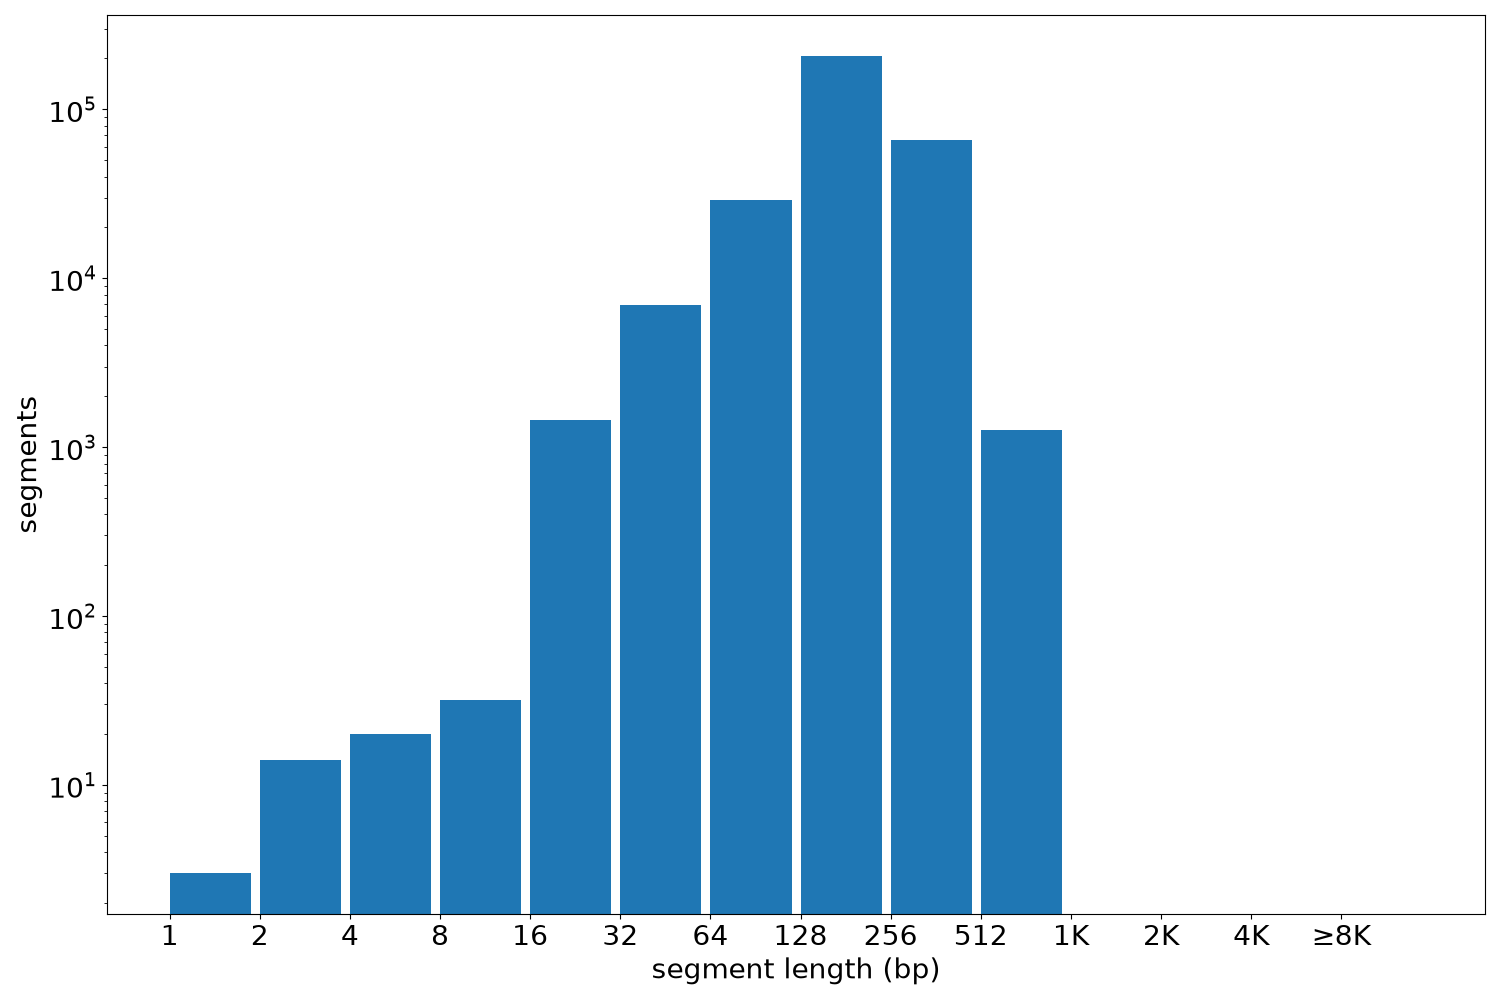
Segment lengths
| segments | min | max | mean | median | |
|---|---|---|---|---|---|
| segments | 311324 | 1 | 1020 | 207.17 | 200 |
Files
| Filename | Size | md5 |
|---|---|---|
| ENCFF612USL.bed.gz | 3.34 MB | 2a7d03db1a4ca02898a19363826853ee |
| ENCFF612USL.tabix.bed.gz | 3.06 MB | 263139f181e235e6a15d6042e490e5e4 |
| ENCFF612USL.tabix.bed.gz.tbi | 720.23 KB | 7a6d79a491191a7626ce24b4f9e944d4 |
| genomic_resource.yaml | 2.11 KB | fa924eb42e6e2e410955316fe8bdda62 |
| statistics/ |