Resource
| Id | DNase-seq/ENCSR571CJM |
|---|---|
| Type | position_score |
| Version | 0 |
| Summary | DNase-seq ENCSR571CJM [biosample_summary="Homo sapiens dorsolateral prefrontal cortex tissue female adult (87 years)"] |
| Description |
status: released biological_replicates: Rep 1 summary: female adult (87 years) output_type: peaks audit_warning: Signal Portion of Tags (SPOT) is a measure of enrichment, analogous to the commonly used fraction of reads in peaks metric. ENCODE processed alignment files {ENCFF902LXF|/files/ENCFF902LXF/} processed by DNase-seq ENCODE4 v3.0.0 GRCh38 pipeline ({ENCPL848KLD|/pipelines/ENCPL848KLD/}) for GRCh38 assembly have a SPOT1 score of 0.27. According to ENCODE standards, SPOT1 score of 0.4 or higher is considered a product of high quality data. Any sample with a SPOT1 score <0.3 should be targeted for replacement with a higher quality sample, and a SPOT1 score of 0.25 is considered minimally acceptable SPOT1 score of 0.25 is considered minimally acceptable for rare and hard to find primary tissues. (See {ENCODE DNase-seq data standards|/data-standards/dnase-seq-encode4/}) |
| Labels |
|
Scores (1)
| ID | Type | Default annotation | Description | Histogram | Range | Summary |
|---|---|---|---|---|---|---|
| DNase-seq_ENCSR571CJM | float |
DNase-seq_ENCSR571CJM |
DNase-seq ENCSR571CJM [biosample_summary="Homo sapiens dorsolateral prefrontal cortex tissue female adult (87 years)"]
|
 |
[0.0324, 13] |
|
n counts base pairs; sd is the population standard deviation.
Coverage
| Chromosome | Covered positions | Covered % | Segments |
|---|---|---|---|
| all chromosomes | 16748668 | 0.52% | 87982 |
| chr1 | 1556884 | 0.63% | 8175 |
| chr2 | 1435982 | 0.59% | 7536 |
| chr3 | 933307 | 0.47% | 4954 |
| chr4 | 611420 | 0.32% | 3170 |
| chr5 | 890105 | 0.49% | 4696 |
| chr6 | 879800 | 0.52% | 4613 |
| chr7 | 788905 | 0.50% | 4193 |
| chr8 | 726423 | 0.50% | 3827 |
| chr9 | 705006 | 0.51% | 3714 |
| chr10 | 951656 | 0.71% | 4989 |
| chr11 | 912410 | 0.68% | 4770 |
| chr12 | 724926 | 0.54% | 3796 |
| chr13 | 357953 | 0.31% | 1906 |
| chr14 | 566552 | 0.53% | 2933 |
| chr15 | 629288 | 0.62% | 3341 |
| chr16 | 573174 | 0.63% | 3070 |
| chr17 | 762213 | 0.92% | 3982 |
| chr18 | 350789 | 0.44% | 1880 |
| chr19 | 787798 | 1.34% | 3997 |
| chr20 | 524105 | 0.81% | 2795 |
| chr21 | 217463 | 0.47% | 1165 |
| chr22 | 432125 | 0.85% | 2232 |
| chrX | 429678 | 0.28% | 2242 |
| chrY | 706 | <0.01% | 6 |
| 3342 contigs with no values (129077085 bp) | 0 | 0.00% | 0 |
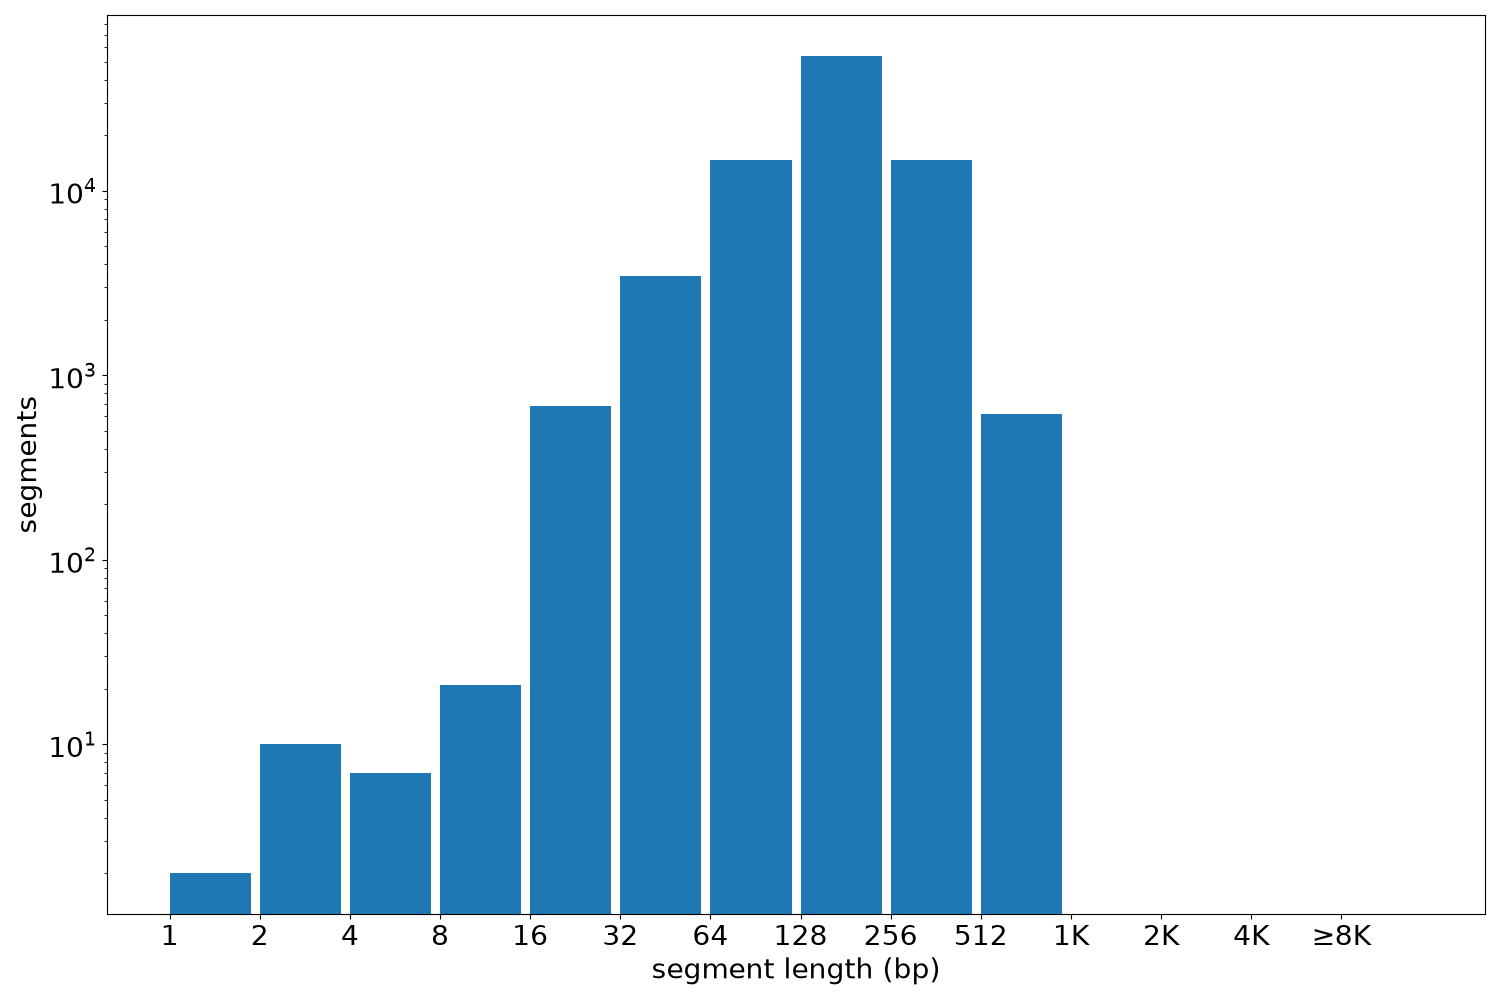
Segment lengths
| segments | min | max | mean | median | |
|---|---|---|---|---|---|
| segments | 87982 | 1 | 1020 | 190.36 | 180 |
Files
| Filename | Size | md5 |
|---|---|---|
| ENCFF079GMX.bed.gz | 953.99 KB | 7ab3f37bcb0f3afc0be0ed1679942d14 |
| ENCFF079GMX.tabix.bed.gz | 875.79 KB | 706ebf4dc3293f4482c28e35b0b26419 |
| ENCFF079GMX.tabix.bed.gz.tbi | 317.06 KB | fb13fdec0c9d9ca97383d59ef1db502e |
| genomic_resource.yaml | 2.09 KB | 3e4aaa9d84c7d81408d1e0012604795d |
| statistics/ |