Resource
| Id | DNase-seq/ENCSR560UTV |
|---|---|
| Type | position_score |
| Version | 0 |
| Summary | DNase-seq ENCSR560UTV [biosample_summary="Homo sapiens central memory CD8-positive, alpha-beta T cell male adult (33 years)"] |
| Description |
status: released biological_replicates: Rep 1 summary: male adult (33 years) output_type: peaks audit_warning: Signal Portion of Tags (SPOT) is a measure of enrichment, analogous to the commonly used fraction of reads in peaks metric. ENCODE processed alignment files {ENCFF275CHT|/files/ENCFF275CHT/} processed by DNase-seq ENCODE4 v3.0.0 GRCh38 pipeline ({ENCPL848KLD|/pipelines/ENCPL848KLD/}) for GRCh38 assembly have a SPOT1 score of 0.29. According to ENCODE standards, SPOT1 score of 0.4 or higher is considered a product of high quality data. Any sample with a SPOT1 score <0.3 should be targeted for replacement with a higher quality sample, and a SPOT1 score of 0.25 is considered minimally acceptable SPOT1 score of 0.25 is considered minimally acceptable for rare and hard to find primary tissues. (See {ENCODE DNase-seq data standards|/data-standards/dnase-seq-encode4/}) |
| Labels |
|
Scores (1)
| ID | Type | Default annotation | Description | Histogram | Range | Summary |
|---|---|---|---|---|---|---|
| DNase-seq_ENCSR560UTV | float |
DNase-seq_ENCSR560UTV |
DNase-seq ENCSR560UTV [biosample_summary="Homo sapiens central memory CD8-positive, alpha-beta T cell male adult (33 years)"]
|
 |
[0.0988, 19.6] |
|
n counts base pairs; sd is the population standard deviation.
Coverage
| Chromosome | Covered positions | Covered % | Segments |
|---|---|---|---|
| all chromosomes | 7853927 | 0.24% | 36700 |
| chr1 | 801483 | 0.32% | 3698 |
| chr2 | 560417 | 0.23% | 2614 |
| chr3 | 402717 | 0.20% | 1855 |
| chr4 | 267061 | 0.14% | 1231 |
| chr5 | 369055 | 0.20% | 1744 |
| chr6 | 427599 | 0.25% | 1951 |
| chr7 | 351590 | 0.22% | 1662 |
| chr8 | 275408 | 0.19% | 1343 |
| chr9 | 315906 | 0.23% | 1489 |
| chr10 | 350734 | 0.26% | 1655 |
| chr11 | 423002 | 0.31% | 2006 |
| chr12 | 385069 | 0.29% | 1787 |
| chr13 | 141484 | 0.12% | 646 |
| chr14 | 306125 | 0.29% | 1445 |
| chr15 | 274500 | 0.27% | 1317 |
| chr16 | 322431 | 0.36% | 1495 |
| chr17 | 477050 | 0.57% | 2200 |
| chr18 | 109848 | 0.14% | 515 |
| chr19 | 533627 | 0.91% | 2355 |
| chr20 | 223367 | 0.35% | 1093 |
| chr21 | 96448 | 0.21% | 481 |
| chr22 | 218031 | 0.43% | 1085 |
| chrX | 211833 | 0.14% | 994 |
| chrY | 9142 | 0.02% | 39 |
| 3342 contigs with no values (129077085 bp) | 0 | 0.00% | 0 |
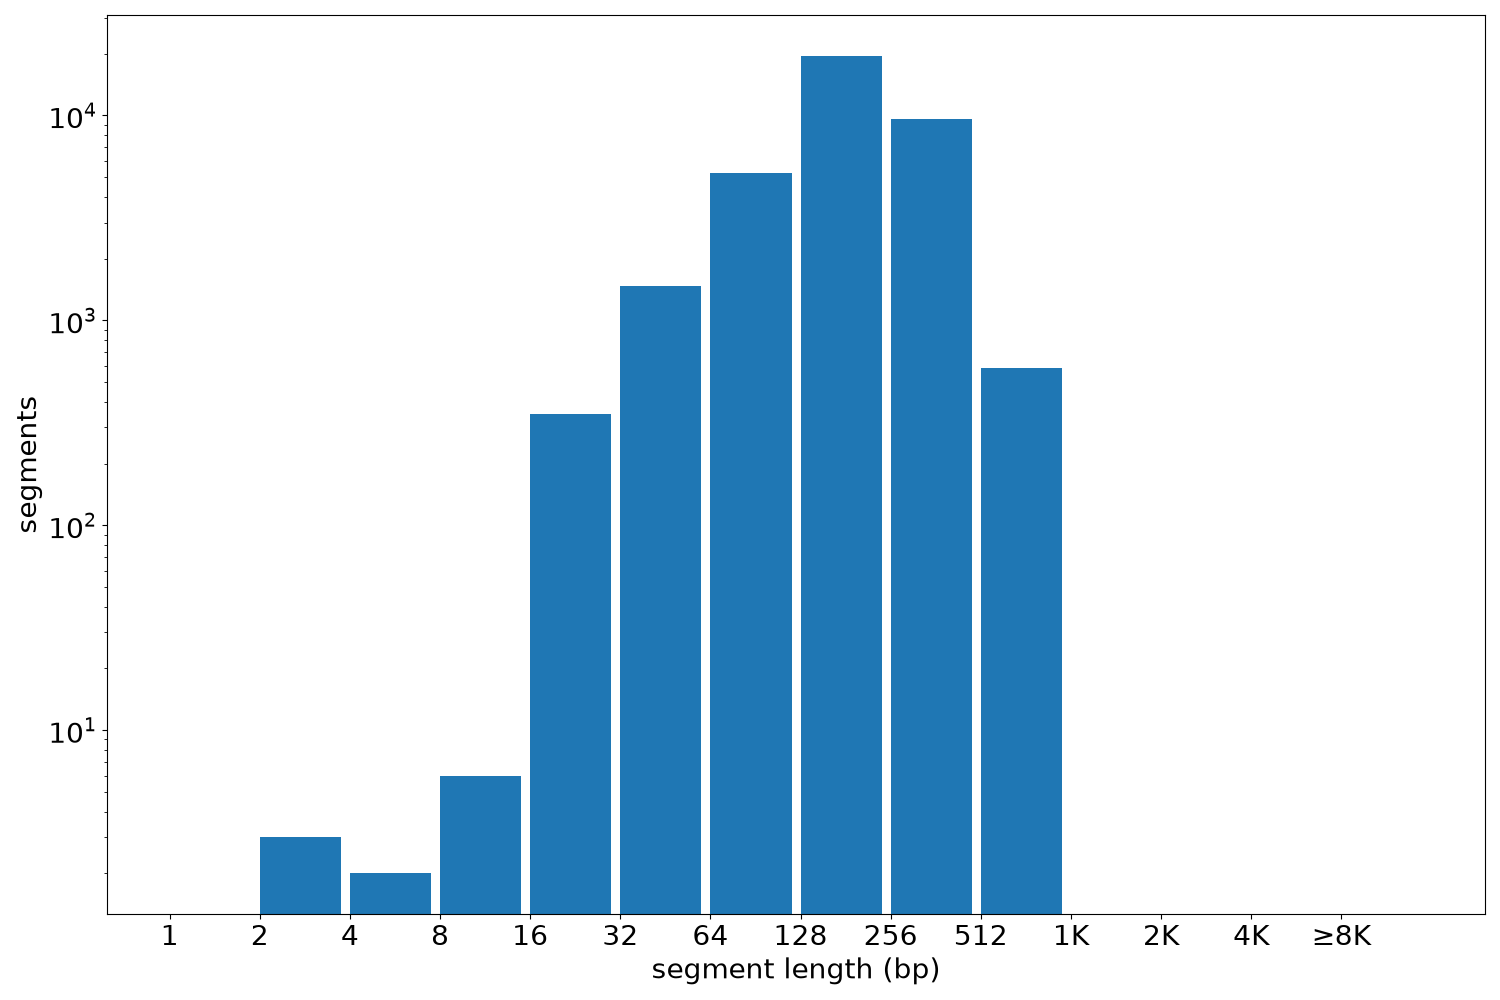
Segment lengths
| segments | min | max | mean | median | |
|---|---|---|---|---|---|
| segments | 36700 | 2 | 1020 | 214 | 200 |
Files
| Filename | Size | md5 |
|---|---|---|
| ENCFF839MRK.bed.gz | 399.07 KB | f6e38ef8564b7dcfe0b90b3e4d643afc |
| ENCFF839MRK.tabix.bed.gz | 368.58 KB | 08603a358b8c65b13c2eeb3cf15a6cac |
| ENCFF839MRK.tabix.bed.gz.tbi | 177.45 KB | b31f29debf96c5c50e97088dfc07f355 |
| genomic_resource.yaml | 2.11 KB | 9f6f5042e8abb10706317445fab22f05 |
| statistics/ |