Resource
| Id | DNase-seq/ENCSR515DVK |
|---|---|
| Type | position_score |
| Version | 0 |
| Summary | DNase-seq ENCSR515DVK [biosample_summary="Homo sapiens CD4-positive, alpha-beta T cell male adult (38 years)"] |
| Description |
status: released biological_replicates: Rep 1 summary: male adult (38 years) output_type: peaks audit_warning: Alignment file {ENCFF649KVR|/files/ENCFF649KVR/} processed by DNase-seq ENCODE4 v3.0.0-alpha.2 GRCh38 pipeline ( {ENCPL848KLD|/pipelines/ENCPL848KLD/} ) for GRCh38 assembly has 29795204 mapped reads. According to ENCODE standards, conventional DNase-seq profile requires a minimum of 20 million uniquely mapped reads to generate a reliable SPOT (Signal Portion of Tags) score. The recommended value is > 50 million. For deep, foot-printing depth DNase-seq 150-200 million uniquely mapped reads are recommended. (See {ENCODE DNase-seq data standards|/data-standards/dnase-seq-encode4/}) audit_warning: Signal Portion of Tags (SPOT) is a measure of enrichment, analogous to the commonly used fraction of reads in peaks metric. ENCODE processed alignment files {ENCFF649KVR|/files/ENCFF649KVR/} processed by DNase-seq ENCODE4 v3.0.0-alpha.2 GRCh38 pipeline ({ENCPL848KLD|/pipelines/ENCPL848KLD/}) for GRCh38 assembly have a SPOT1 score of 0.32. According to ENCODE standards, SPOT1 score of 0.4 or higher is considered a product of high quality data. Any sample with a SPOT1 score <0.3 should be targeted for replacement with a higher quality sample, and a SPOT1 score of 0.25 is considered minimally acceptable SPOT1 score of 0.25 is considered minimally acceptable for rare and hard to find primary tissues. (See {ENCODE DNase-seq data standards|/data-standards/dnase-seq-encode4/}) |
| Labels |
|
Scores (1)
| ID | Type | Default annotation | Description | Histogram | Range | Summary |
|---|---|---|---|---|---|---|
| DNase-seq_ENCSR515DVK | float |
DNase-seq_ENCSR515DVK |
DNase-seq ENCSR515DVK [biosample_summary="Homo sapiens CD4-positive, alpha-beta T cell male adult (38 years)"]
|
 |
[0.337, 29.3] |
|
n counts base pairs; sd is the population standard deviation.
Coverage
| Chromosome | Covered positions | Covered % | Segments |
|---|---|---|---|
| all chromosomes | 5090894 | 0.16% | 27936 |
| chr1 | 524514 | 0.21% | 2886 |
| chr2 | 352464 | 0.15% | 1941 |
| chr3 | 279006 | 0.14% | 1529 |
| chr4 | 175622 | 0.09% | 967 |
| chr5 | 225898 | 0.12% | 1231 |
| chr6 | 285539 | 0.17% | 1582 |
| chr7 | 236306 | 0.15% | 1293 |
| chr8 | 181689 | 0.13% | 1022 |
| chr9 | 197273 | 0.14% | 1088 |
| chr10 | 214525 | 0.16% | 1193 |
| chr11 | 272315 | 0.20% | 1486 |
| chr12 | 266824 | 0.20% | 1461 |
| chr13 | 101391 | 0.09% | 554 |
| chr14 | 172631 | 0.16% | 965 |
| chr15 | 163687 | 0.16% | 917 |
| chr16 | 212976 | 0.24% | 1165 |
| chr17 | 311558 | 0.37% | 1705 |
| chr18 | 73824 | 0.09% | 414 |
| chr19 | 377903 | 0.64% | 1973 |
| chr20 | 140804 | 0.22% | 788 |
| chr21 | 58483 | 0.13% | 339 |
| chr22 | 126754 | 0.25% | 691 |
| chrX | 133457 | 0.09% | 719 |
| chrY | 5451 | 0.01% | 27 |
| 3342 contigs with no values (129077085 bp) | 0 | 0.00% | 0 |
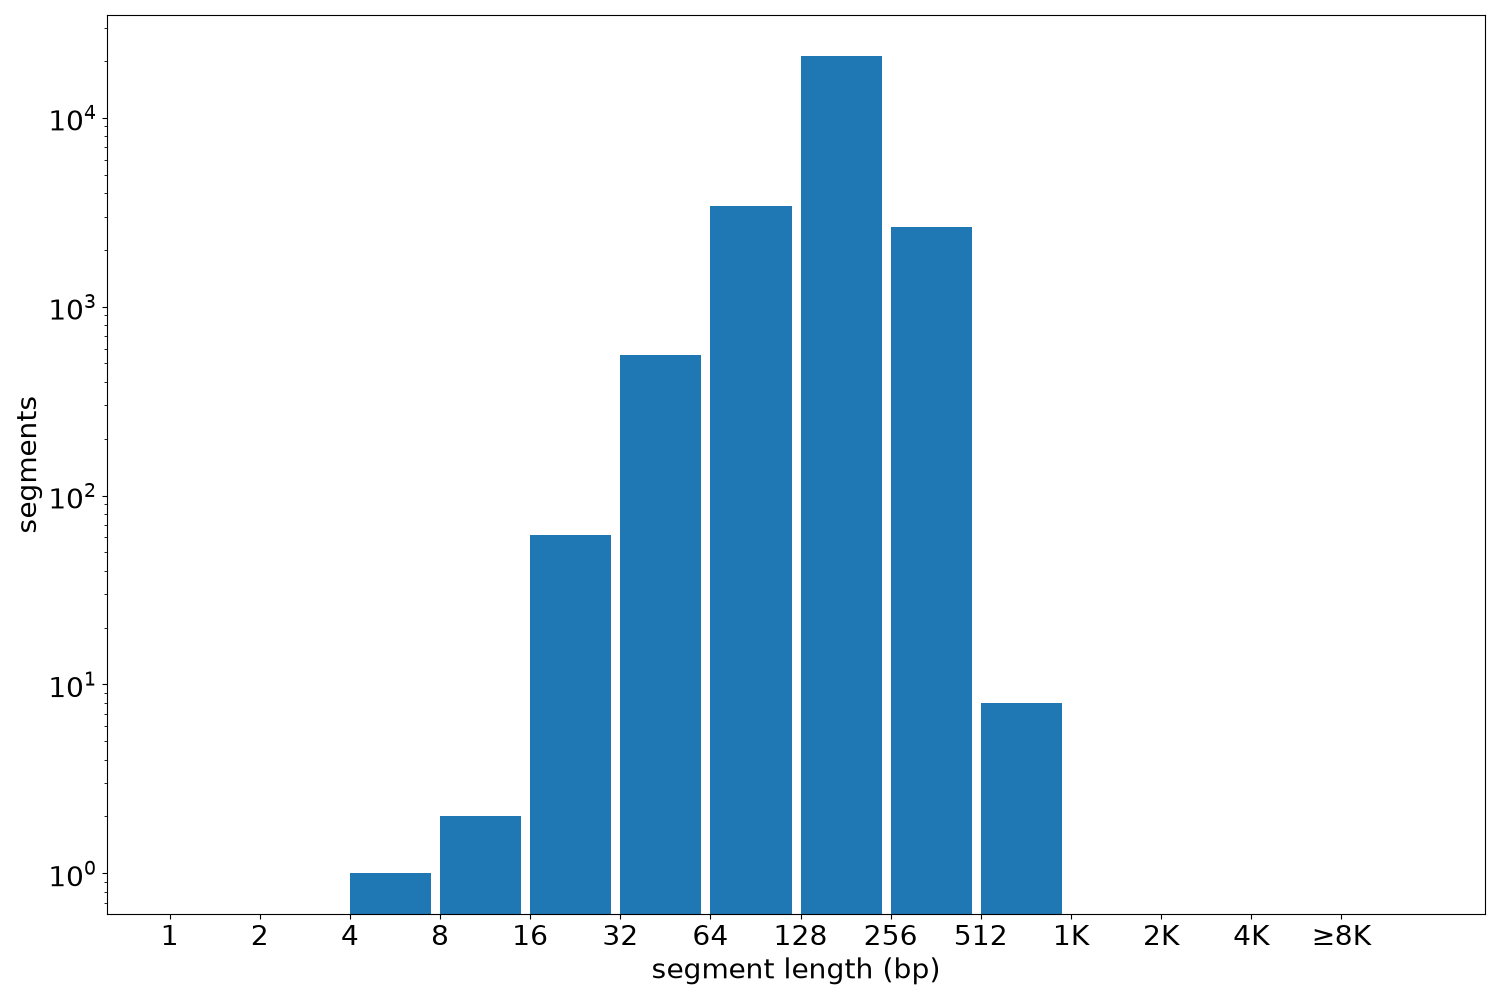
Segment lengths
| segments | min | max | mean | median | |
|---|---|---|---|---|---|
| segments | 27936 | 6 | 680 | 182.23 | 180 |
Files
| Filename | Size | md5 |
|---|---|---|
| ENCFF819DSS.bed.gz | 304.8 KB | b0c95c477955deb0c8be9fede636224e |
| ENCFF819DSS.tabix.bed.gz | 274.45 KB | f173d56a401617cf92d1e9993922c825 |
| ENCFF819DSS.tabix.bed.gz.tbi | 172.01 KB | 6ffd844b3df1a2f750816089b09be5ba |
| genomic_resource.yaml | 2.7 KB | c5b7132908469b29d2c691f53a8faed0 |
| statistics/ |