Resource
| Id | DNase-seq/ENCSR503BEM |
|---|---|
| Type | position_score |
| Version | 0 |
| Summary | DNase-seq ENCSR503BEM [biosample_summary="Homo sapiens LoVo"] |
| Description |
status: released biological_replicates: Rep 1 summary: output_type: peaks audit_internal_action: Archived analysis {ENCAN997SWP|/analyses/ENCAN997SWP/} has in progress subobject quality standard {encode3-dnase|/quality-standards/encode3-dnase/} audit_warning: Signal Portion of Tags (SPOT) is a measure of enrichment, analogous to the commonly used fraction of reads in peaks metric. ENCODE processed alignment files {ENCFF615YBI|/files/ENCFF615YBI/} processed by DNase-seq ENCODE3 GRCh38 pipeline ({ENCPL202DNS|/pipelines/ENCPL202DNS/}) for GRCh38 assembly have a SPOT1 score of 0.38. According to ENCODE standards, SPOT1 score of 0.4 or higher is considered a product of high quality data. Any sample with a SPOT1 score <0.3 should be targeted for replacement with a higher quality sample, and a SPOT1 score of 0.25 is considered minimally acceptable SPOT1 score of 0.25 is considered minimally acceptable for rare and hard to find primary tissues. (See {ENCODE DNase-seq data standards|/data-standards/dnase-seq/}) audit_warning: Signal Portion of Tags (SPOT) is a measure of enrichment, analogous to the commonly used fraction of reads in peaks metric. ENCODE processed alignment files {ENCFF478GDA|/files/ENCFF478GDA/} processed by DNase-seq ENCODE3 GRCh38 pipeline ({ENCPL202DNS|/pipelines/ENCPL202DNS/}) for GRCh38 assembly have a SPOT1 score of 0.29. According to ENCODE standards, SPOT1 score of 0.4 or higher is considered a product of high quality data. Any sample with a SPOT1 score <0.3 should be targeted for replacement with a higher quality sample, and a SPOT1 score of 0.25 is considered minimally acceptable SPOT1 score of 0.25 is considered minimally acceptable for rare and hard to find primary tissues. (See {ENCODE DNase-seq data standards|/data-standards/dnase-seq/}) |
| Labels |
|
Scores (1)
| ID | Type | Default annotation | Description | Histogram | Range | Summary |
|---|---|---|---|---|---|---|
| DNase-seq_ENCSR503BEM | float |
DNase-seq_ENCSR503BEM |
DNase-seq ENCSR503BEM [biosample_summary="Homo sapiens LoVo"]
|
 |
[6, 9.89e+04] |
|
n counts base pairs; sd is the population standard deviation.
Coverage
| Chromosome | Covered positions | Covered % | Segments |
|---|---|---|---|
| all chromosomes | 21895681 | 0.68% | 145709 |
| chr1 | 2038276 | 0.82% | 13569 |
| chr2 | 1696057 | 0.70% | 11290 |
| chr3 | 1335817 | 0.67% | 8885 |
| chr4 | 1118238 | 0.59% | 7437 |
| chr5 | 1225939 | 0.68% | 8157 |
| chr6 | 1339580 | 0.78% | 8914 |
| chr7 | 1217979 | 0.76% | 8099 |
| chr8 | 911695 | 0.63% | 6069 |
| chr9 | 896310 | 0.65% | 5963 |
| chr10 | 1028780 | 0.77% | 6843 |
| chr11 | 1061978 | 0.79% | 7070 |
| chr12 | 1240823 | 0.93% | 8253 |
| chr13 | 544666 | 0.48% | 3620 |
| chr14 | 709789 | 0.66% | 4721 |
| chr15 | 750802 | 0.74% | 5000 |
| chr16 | 687516 | 0.76% | 4576 |
| chr17 | 959847 | 1.15% | 6393 |
| chr18 | 458074 | 0.57% | 3053 |
| chr19 | 785435 | 1.34% | 5230 |
| chr20 | 580747 | 0.90% | 3863 |
| chr21 | 231021 | 0.49% | 1537 |
| chr22 | 394115 | 0.78% | 2624 |
| chrX | 631824 | 0.40% | 4208 |
| chrY | 50373 | 0.09% | 335 |
| 3342 contigs with no values (129077085 bp) | 0 | 0.00% | 0 |
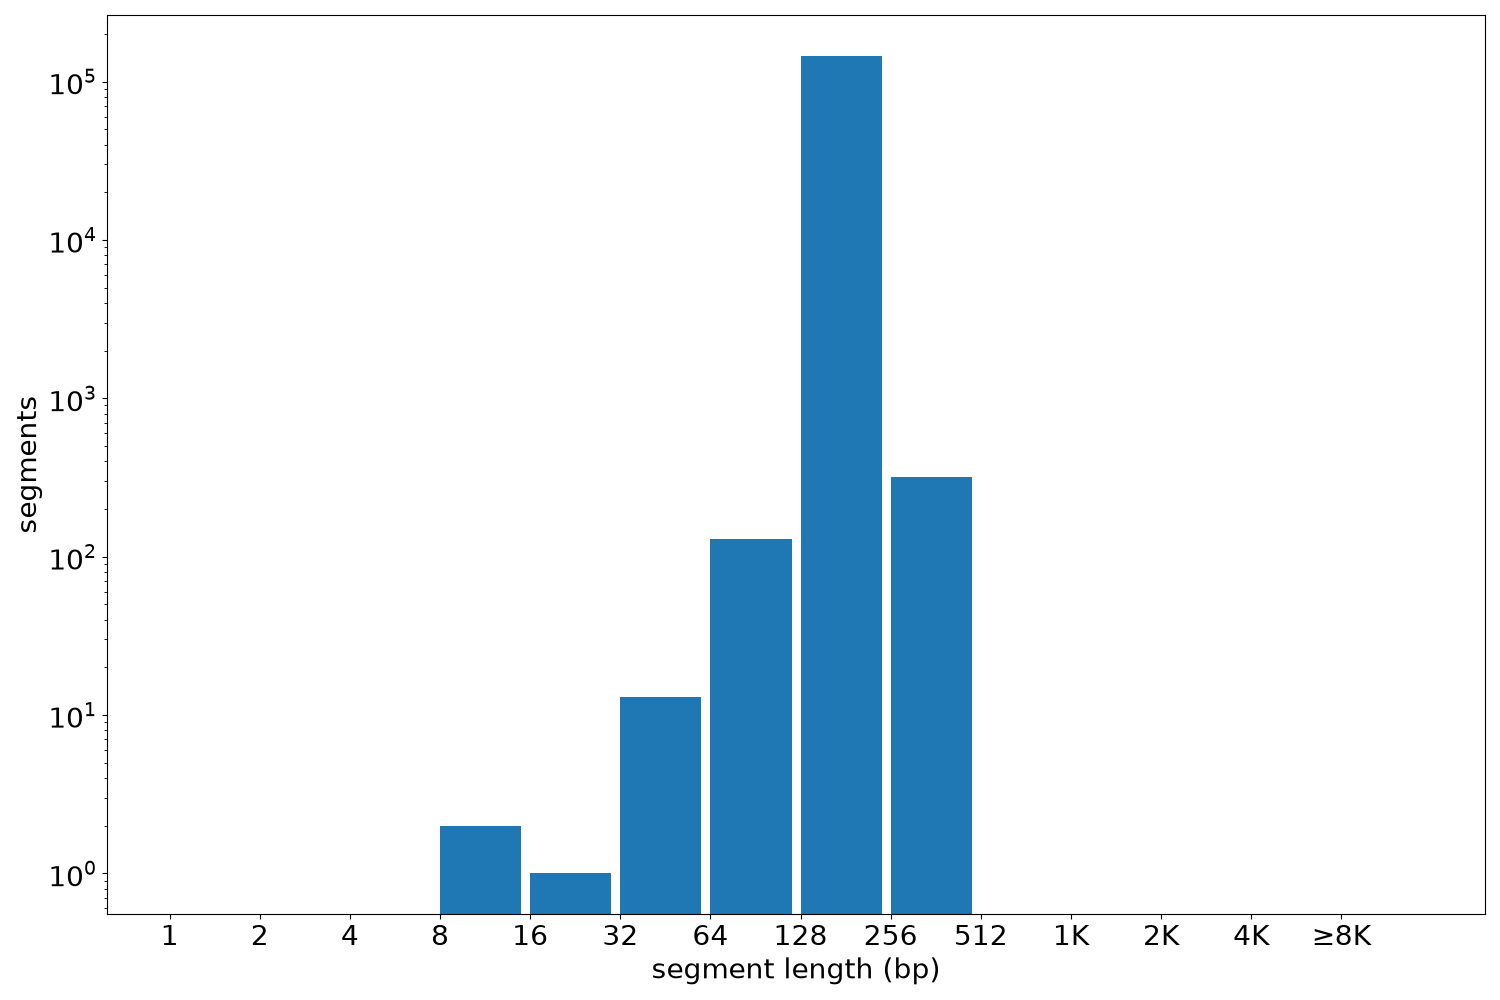
Segment lengths
| segments | min | max | mean | median | |
|---|---|---|---|---|---|
| segments | 145709 | 11 | 300 | 150.27 | 150 |
Files
| Filename | Size | md5 |
|---|---|---|
| ENCFF586BVY.bed.gz | 1.41 MB | a02afd7244be2411051dad2609db5799 |
| ENCFF586BVY.tabix.bed.gz | 1.22 MB | ebfc716efd014fae1c3c94b034fcc975 |
| ENCFF586BVY.tabix.bed.gz.tbi | 521.28 KB | cfc320139da4fe0ef85e892fc2faf140 |
| genomic_resource.yaml | 2.91 KB | d01d96c51e9de0aeca051e31ad4250b9 |
| statistics/ |