Resource
| Id | DNase-seq/ENCSR468AKF |
|---|---|
| Type | position_score |
| Version | 0 |
| Summary | DNase-seq ENCSR468AKF [biosample_summary="Homo sapiens B cell male adult (22 years)"] |
| Description |
status: released biological_replicates: Rep 1 summary: male adult (22 years) output_type: peaks audit_warning: Signal Portion of Tags (SPOT) is a measure of enrichment, analogous to the commonly used fraction of reads in peaks metric. ENCODE processed alignment files {ENCFF213FNG|/files/ENCFF213FNG/} processed by DNase-seq ENCODE4 v3.0.0-alpha.2 GRCh38 pipeline ({ENCPL848KLD|/pipelines/ENCPL848KLD/}) for GRCh38 assembly have a SPOT1 score of 0.38. According to ENCODE standards, SPOT1 score of 0.4 or higher is considered a product of high quality data. Any sample with a SPOT1 score <0.3 should be targeted for replacement with a higher quality sample, and a SPOT1 score of 0.25 is considered minimally acceptable SPOT1 score of 0.25 is considered minimally acceptable for rare and hard to find primary tissues. (See {ENCODE DNase-seq data standards|/data-standards/dnase-seq-encode4/}) |
| Labels |
|
Scores (1)
| ID | Type | Default annotation | Description | Histogram | Range | Summary |
|---|---|---|---|---|---|---|
| DNase-seq_ENCSR468AKF | float |
DNase-seq_ENCSR468AKF |
DNase-seq ENCSR468AKF [biosample_summary="Homo sapiens B cell male adult (22 years)"]
|
 |
[0.0508, 33.6] |
|
n counts base pairs; sd is the population standard deviation.
Coverage
| Chromosome | Covered positions | Covered % | Segments |
|---|---|---|---|
| all chromosomes | 14814476 | 0.46% | 83766 |
| chr1 | 1465966 | 0.59% | 8213 |
| chr2 | 1238010 | 0.51% | 7098 |
| chr3 | 790438 | 0.40% | 4541 |
| chr4 | 453620 | 0.24% | 2567 |
| chr5 | 663782 | 0.37% | 3746 |
| chr6 | 775665 | 0.45% | 4281 |
| chr7 | 666188 | 0.42% | 3776 |
| chr8 | 626629 | 0.43% | 3611 |
| chr9 | 632612 | 0.46% | 3611 |
| chr10 | 861688 | 0.64% | 4979 |
| chr11 | 830732 | 0.61% | 4676 |
| chr12 | 685675 | 0.51% | 3856 |
| chr13 | 270650 | 0.24% | 1551 |
| chr14 | 516580 | 0.48% | 2923 |
| chr15 | 531095 | 0.52% | 3059 |
| chr16 | 601263 | 0.67% | 3382 |
| chr17 | 829111 | 1.00% | 4641 |
| chr18 | 280878 | 0.35% | 1631 |
| chr19 | 709734 | 1.21% | 3793 |
| chr20 | 477757 | 0.74% | 2748 |
| chr21 | 179935 | 0.39% | 1039 |
| chr22 | 421446 | 0.83% | 2380 |
| chrX | 291359 | 0.19% | 1585 |
| chrY | 13663 | 0.02% | 79 |
| 3342 contigs with no values (129077085 bp) | 0 | 0.00% | 0 |
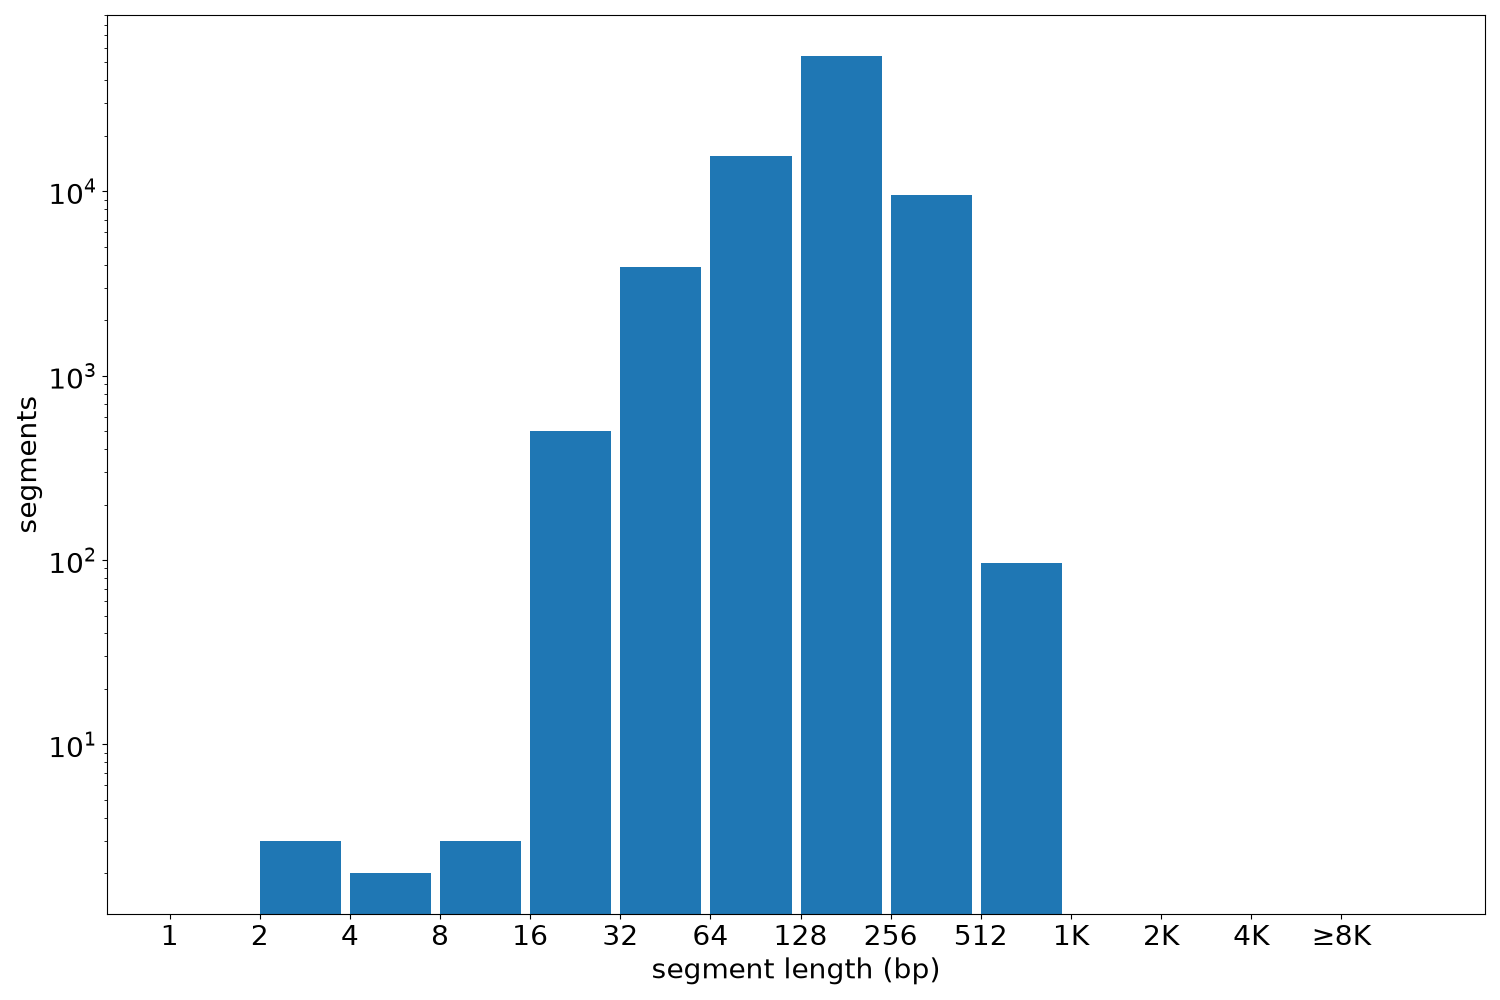
Segment lengths
| segments | min | max | mean | median | |
|---|---|---|---|---|---|
| segments | 83766 | 2 | 880 | 176.86 | 180 |
Files
| Filename | Size | md5 |
|---|---|---|
| ENCFF650BNV.bed.gz | 906.79 KB | bc6e2f152c3946d01f3d10e294b70c20 |
| ENCFF650BNV.tabix.bed.gz | 827.2 KB | 51c09e5b7deaa6e50bdcf8b474c2212f |
| ENCFF650BNV.tabix.bed.gz.tbi | 254.12 KB | 483f25e873c737d94dda1461f165a85a |
| genomic_resource.yaml | 2.0 KB | bc22c65d383f13e3a2b16dc2333de8c1 |
| statistics/ |