Resource
| Id | DNase-seq/ENCSR428ZCP |
|---|---|
| Type | position_score |
| Version | 0 |
| Summary | DNase-seq ENCSR428ZCP [biosample_summary="Homo sapiens with Cognitive impairment, Alzheimer''s disease; dorsolateral prefrontal cortex tissue female adult (90 or above years)"] |
| Description |
status: released biological_replicates: Rep 1 summary: female adult (90 or above years) with Cognitive impairment, Alzheimer's disease output_type: peaks audit_warning: Signal Portion of Tags (SPOT) is a measure of enrichment, analogous to the commonly used fraction of reads in peaks metric. ENCODE processed alignment files {ENCFF446JDN|/files/ENCFF446JDN/} processed by DNase-seq ENCODE4 v3.0.0-alpha.2 GRCh38 pipeline ({ENCPL848KLD|/pipelines/ENCPL848KLD/}) for GRCh38 assembly have a SPOT1 score of 0.37. According to ENCODE standards, SPOT1 score of 0.4 or higher is considered a product of high quality data. Any sample with a SPOT1 score <0.3 should be targeted for replacement with a higher quality sample, and a SPOT1 score of 0.25 is considered minimally acceptable SPOT1 score of 0.25 is considered minimally acceptable for rare and hard to find primary tissues. (See {ENCODE DNase-seq data standards|/data-standards/dnase-seq-encode4/}) |
| Labels |
|
Scores (1)
| ID | Type | Default annotation | Description | Histogram | Range | Summary |
|---|---|---|---|---|---|---|
| DNase-seq_ENCSR428ZCP | float |
DNase-seq_ENCSR428ZCP |
DNase-seq ENCSR428ZCP [biosample_summary="Homo sapiens with Cognitive impairment, Alzheimer''s disease; dorsolateral prefrontal cortex tissue female adult (90 or above years)"]
|
 |
[0.0622, 20.7] |
|
n counts base pairs; sd is the population standard deviation.
Coverage
| Chromosome | Covered positions | Covered % | Segments |
|---|---|---|---|
| all chromosomes | 13894170 | 0.43% | 73559 |
| chr1 | 1298335 | 0.52% | 6865 |
| chr2 | 1096973 | 0.45% | 5836 |
| chr3 | 774526 | 0.39% | 4134 |
| chr4 | 528195 | 0.28% | 2752 |
| chr5 | 682541 | 0.38% | 3655 |
| chr6 | 695767 | 0.41% | 3648 |
| chr7 | 689025 | 0.43% | 3672 |
| chr8 | 638171 | 0.44% | 3363 |
| chr9 | 656964 | 0.47% | 3462 |
| chr10 | 742309 | 0.55% | 3931 |
| chr11 | 781432 | 0.58% | 4142 |
| chr12 | 637926 | 0.48% | 3367 |
| chr13 | 272198 | 0.24% | 1480 |
| chr14 | 473267 | 0.44% | 2501 |
| chr15 | 439845 | 0.43% | 2335 |
| chr16 | 507884 | 0.56% | 2709 |
| chr17 | 680176 | 0.82% | 3627 |
| chr18 | 256887 | 0.32% | 1381 |
| chr19 | 683879 | 1.17% | 3495 |
| chr20 | 413508 | 0.64% | 2224 |
| chr21 | 196061 | 0.42% | 1030 |
| chr22 | 405168 | 0.80% | 2144 |
| chrX | 342319 | 0.22% | 1799 |
| chrY | 814 | <0.01% | 7 |
| 3342 contigs with no values (129077085 bp) | 0 | 0.00% | 0 |
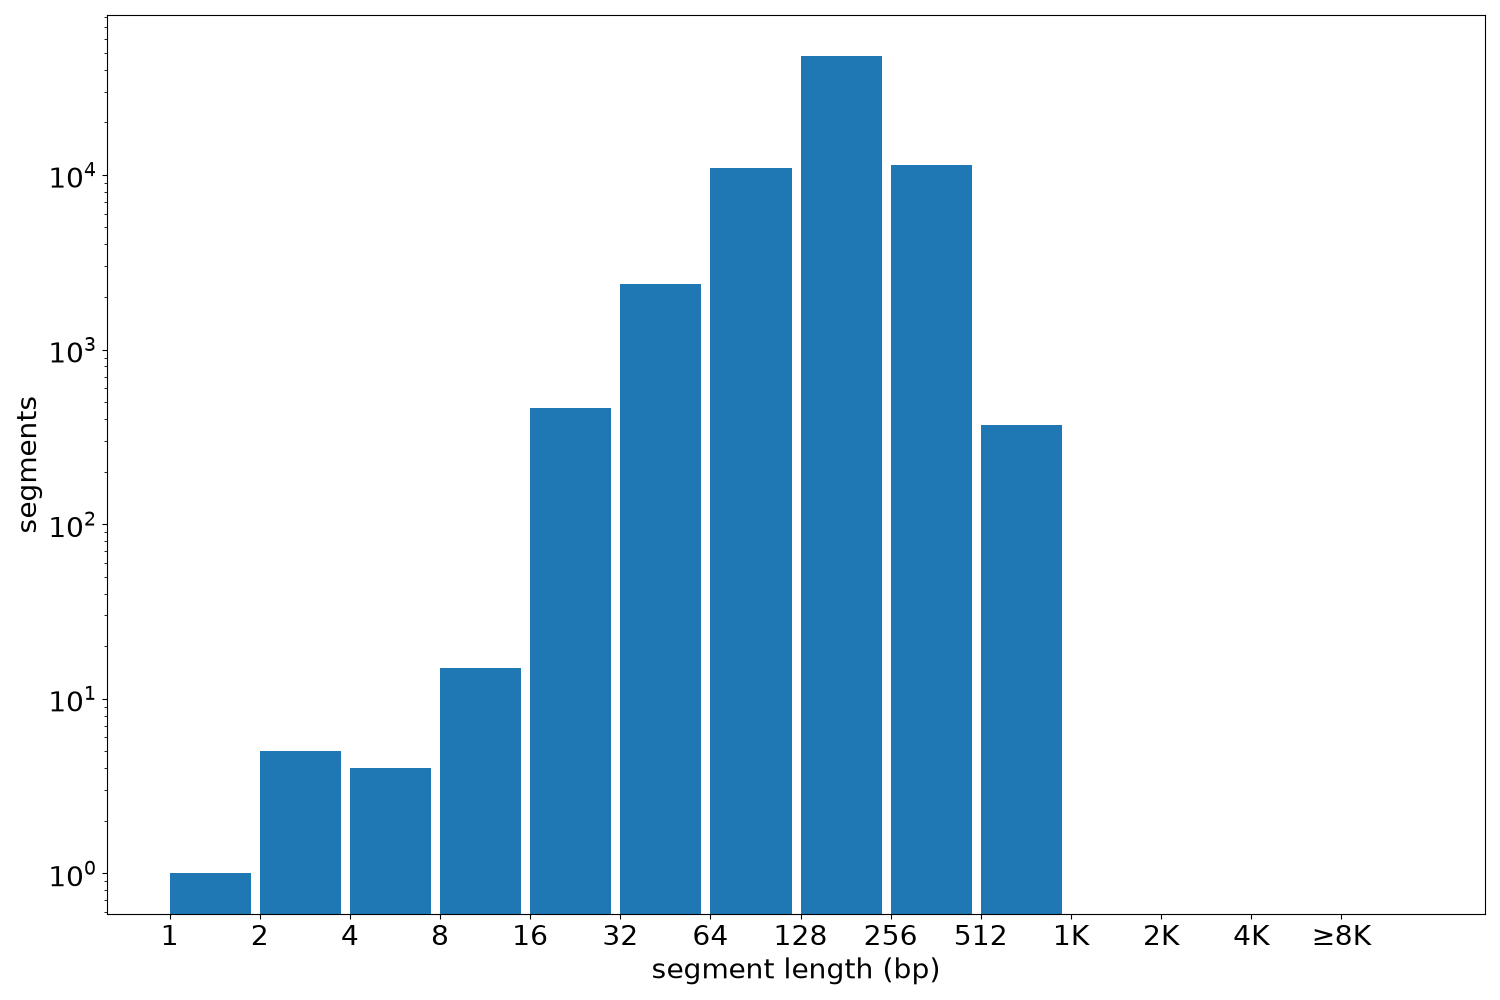
Segment lengths
| segments | min | max | mean | median | |
|---|---|---|---|---|---|
| segments | 73559 | 1 | 890 | 188.88 | 180 |
Files
| Filename | Size | md5 |
|---|---|---|
| ENCFF367PTQ.bed.gz | 807.58 KB | a0cddca5e05cca4067e02c166eb18153 |
| ENCFF367PTQ.tabix.bed.gz | 738.05 KB | b18b5ec25adbc018a8f06859cd717a0c |
| ENCFF367PTQ.tabix.bed.gz.tbi | 290.48 KB | fe583b30dddc0d498f6e47824e9d2f0a |
| genomic_resource.yaml | 2.39 KB | ea33f3a90d02ea80edf6e965019fffb5 |
| statistics/ |