Resource
| Id | DNase-seq/ENCSR409ZBD |
|---|---|
| Type | position_score |
| Version | 0 |
| Summary | DNase-seq ENCSR409ZBD [biosample_summary="Homo sapiens natural killer cell male adult (47 years) treated with 100 ng/mL Interleukin-12 subunit alpha for 72 hours, 100 ng/mL Interleukin-15 for 72 hours, 100 ng/mL Interleukin-12 subunit beta for 72 hours, 100 ng/mL Interleukin-18 for 72 hours"] |
| Description |
status: released biological_replicates: Rep 1 summary: male adult (47 years) treated with 100 ng/mL Interleukin-12 subunit alpha for 72 hours, 100 ng/mL Interleukin-15 for 72 hours, 100 ng/mL Interleukin-12 subunit beta for 72 hours, 100 ng/mL Interleukin-18 for 72 hours output_type: peaks audit_error: Signal Portion of Tags (SPOT) is a measure of enrichment, analogous to the commonly used fraction of reads in peaks metric. ENCODE processed alignment files {ENCFF286KKJ|/files/ENCFF286KKJ/} processed by DNase-seq ENCODE4 v3.0.0 GRCh38 pipeline ({ENCPL848KLD|/pipelines/ENCPL848KLD/}) for GRCh38 assembly have a SPOT1 score of 0.24. According to ENCODE standards, SPOT1 score of 0.4 or higher is considered a product of high quality data. Any sample with a SPOT1 score <0.3 should be targeted for replacement with a higher quality sample, and a SPOT1 score of 0.25 is considered minimally acceptable SPOT1 score of 0.25 is considered minimally acceptable for rare and hard to find primary tissues. (See {ENCODE DNase-seq data standards|/data-standards/dnase-seq-encode4/}) |
| Labels |
|
Scores (1)
| ID | Type | Default annotation | Description | Histogram | Range | Summary |
|---|---|---|---|---|---|---|
| DNase-seq_ENCSR409ZBD | float |
DNase-seq_ENCSR409ZBD |
DNase-seq ENCSR409ZBD [biosample_summary="Homo sapiens natural killer cell male adult (47 years) treated with 100 ng/mL Interleukin-12 subunit alpha for 72 hours, 100 ng/mL Interleukin-15 for 72 hours, 100 ng/mL Interleukin-12 subunit beta for 72 hours, 100 ng/mL Interleukin-18 for 72 hours"]
|
 |
[0.0471, 19.7] |
|
n counts base pairs; sd is the population standard deviation.
Coverage
| Chromosome | Covered positions | Covered % | Segments |
|---|---|---|---|
| all chromosomes | 24487815 | 0.76% | 117081 |
| chr1 | 2169517 | 0.87% | 10265 |
| chr2 | 2368491 | 0.98% | 11272 |
| chr3 | 1341858 | 0.68% | 6492 |
| chr4 | 547627 | 0.29% | 2698 |
| chr5 | 1214348 | 0.67% | 5772 |
| chr6 | 1267836 | 0.74% | 6023 |
| chr7 | 1226239 | 0.77% | 5936 |
| chr8 | 1097916 | 0.76% | 5284 |
| chr9 | 1005051 | 0.73% | 4807 |
| chr10 | 1826427 | 1.37% | 8593 |
| chr11 | 1156512 | 0.86% | 5616 |
| chr12 | 857582 | 0.64% | 4148 |
| chr13 | 644795 | 0.56% | 3111 |
| chr14 | 855718 | 0.80% | 4035 |
| chr15 | 1199217 | 1.18% | 5595 |
| chr16 | 811081 | 0.90% | 3946 |
| chr17 | 1009549 | 1.21% | 4898 |
| chr18 | 654823 | 0.81% | 3134 |
| chr19 | 970270 | 1.66% | 4638 |
| chr20 | 874124 | 1.36% | 4133 |
| chr21 | 371967 | 0.80% | 1806 |
| chr22 | 646479 | 1.27% | 3063 |
| chrX | 358323 | 0.23% | 1754 |
| chrY | 12065 | 0.02% | 62 |
| 3342 contigs with no values (129077085 bp) | 0 | 0.00% | 0 |
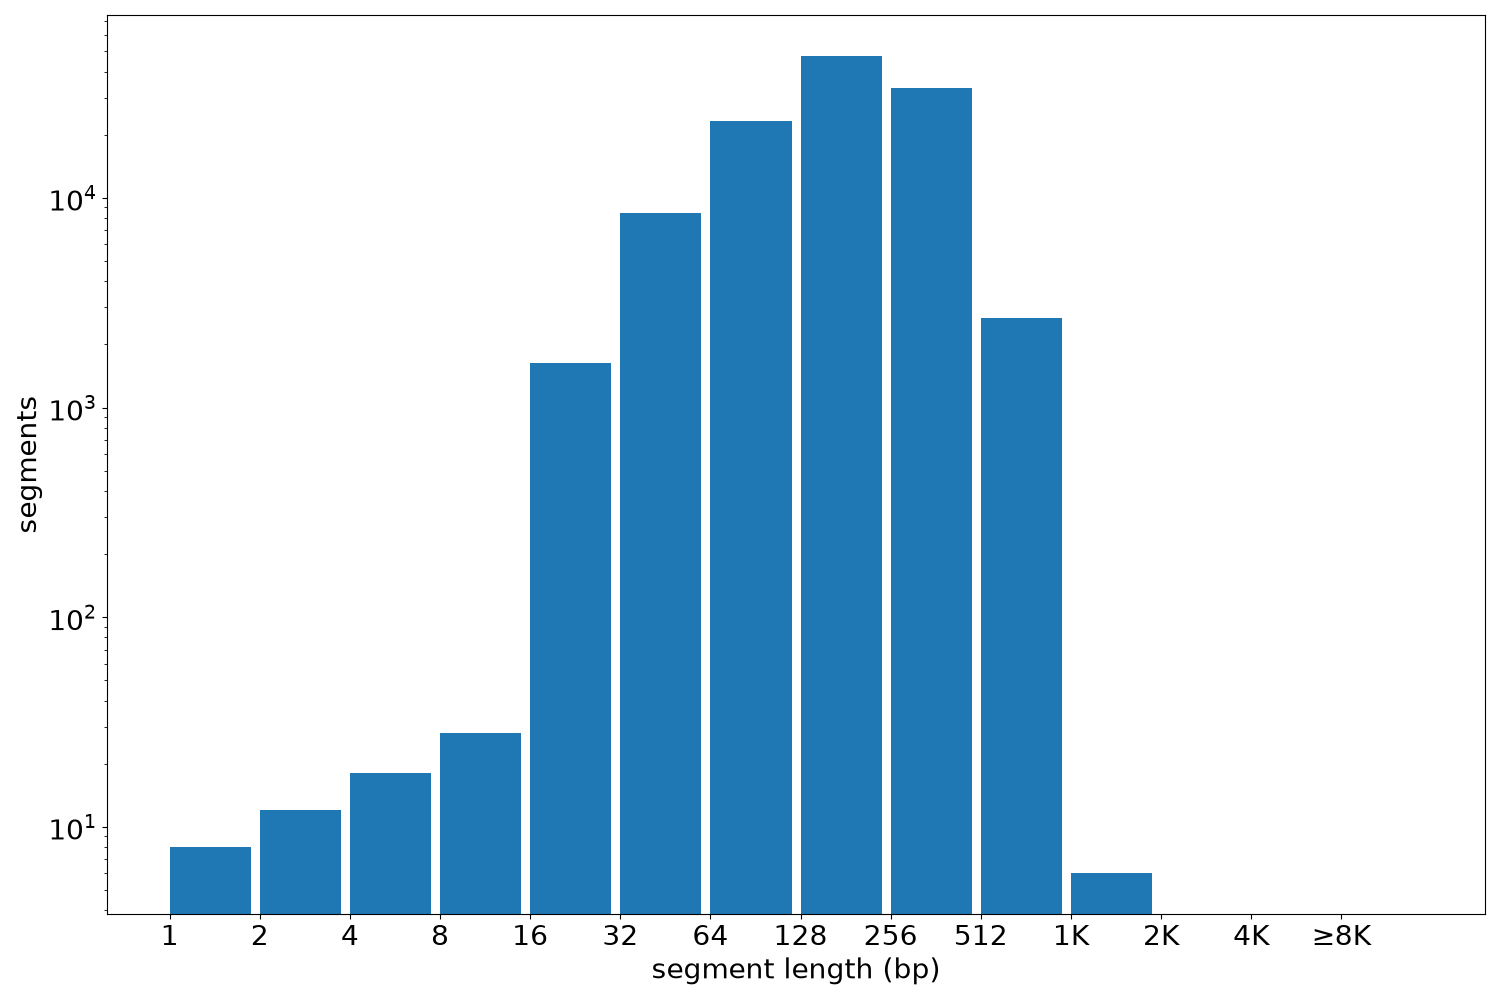
Segment lengths
| segments | min | max | mean | median | |
|---|---|---|---|---|---|
| segments | 117081 | 1 | 1172 | 209.15 | 200 |
Files
| Filename | Size | md5 |
|---|---|---|
| ENCFF027BPY.bed.gz | 1.13 MB | ba16da4685468b8593a685aed7242454 |
| ENCFF027BPY.tabix.bed.gz | 1.06 MB | 8c8460e66e948a4d3e58717de090d592 |
| ENCFF027BPY.tabix.bed.gz.tbi | 253.79 KB | 039a72af6c06fc7d9ad364479bad74e4 |
| genomic_resource.yaml | 3.01 KB | c4c0817bcd11f505c66c532909490e71 |
| statistics/ |