Resource
| Id | DNase-seq/ENCSR362ZFC |
|---|---|
| Type | position_score |
| Version | 0 |
| Summary | DNase-seq ENCSR362ZFC [biosample_summary="Homo sapiens type B pancreatic cell"] |
| Description |
status: released biological_replicates: Rep 1 summary: female embryo (5 days) output_type: peaks audit_error: Signal Portion of Tags (SPOT) is a measure of enrichment, analogous to the commonly used fraction of reads in peaks metric. ENCODE processed alignment files {ENCFF843AJO|/files/ENCFF843AJO/} processed by DNase-seq ENCODE4 v3.0.0 GRCh38 pipeline ({ENCPL848KLD|/pipelines/ENCPL848KLD/}) for GRCh38 assembly have a SPOT1 score of 0.23. According to ENCODE standards, SPOT1 score of 0.4 or higher is considered a product of high quality data. Any sample with a SPOT1 score <0.3 should be targeted for replacement with a higher quality sample, and a SPOT1 score of 0.25 is considered minimally acceptable SPOT1 score of 0.25 is considered minimally acceptable for rare and hard to find primary tissues. (See {ENCODE DNase-seq data standards|/data-standards/dnase-seq-encode4/}) |
| Labels |
|
Scores (1)
| ID | Type | Default annotation | Description | Histogram | Range | Summary |
|---|---|---|---|---|---|---|
| DNase-seq_ENCSR362ZFC | float |
DNase-seq_ENCSR362ZFC |
DNase-seq ENCSR362ZFC [biosample_summary="Homo sapiens type B pancreatic cell"]
|
 |
[0.046, 7.61] |
|
n counts base pairs; sd is the population standard deviation.
Coverage
| Chromosome | Covered positions | Covered % | Segments |
|---|---|---|---|
| all chromosomes | 20310707 | 0.63% | 92827 |
| chr1 | 1828247 | 0.73% | 8210 |
| chr2 | 1917865 | 0.79% | 8703 |
| chr3 | 1000839 | 0.50% | 4530 |
| chr4 | 618996 | 0.33% | 2823 |
| chr5 | 1029447 | 0.57% | 4750 |
| chr6 | 790557 | 0.46% | 3617 |
| chr7 | 1058389 | 0.66% | 4843 |
| chr8 | 807715 | 0.56% | 3615 |
| chr9 | 950732 | 0.69% | 4306 |
| chr10 | 1369689 | 1.02% | 6205 |
| chr11 | 1092265 | 0.81% | 4995 |
| chr12 | 717554 | 0.54% | 3315 |
| chr13 | 426888 | 0.37% | 1922 |
| chr14 | 685109 | 0.64% | 3081 |
| chr15 | 760333 | 0.75% | 3580 |
| chr16 | 686067 | 0.76% | 3269 |
| chr17 | 900750 | 1.08% | 4171 |
| chr18 | 454205 | 0.57% | 2070 |
| chr19 | 818471 | 1.40% | 3935 |
| chr20 | 692861 | 1.08% | 3229 |
| chr21 | 392353 | 0.84% | 1709 |
| chr22 | 820393 | 1.61% | 3661 |
| chrX | 490043 | 0.31% | 2281 |
| chrY | 939 | <0.01% | 7 |
| 3342 contigs with no values (129077085 bp) | 0 | 0.00% | 0 |
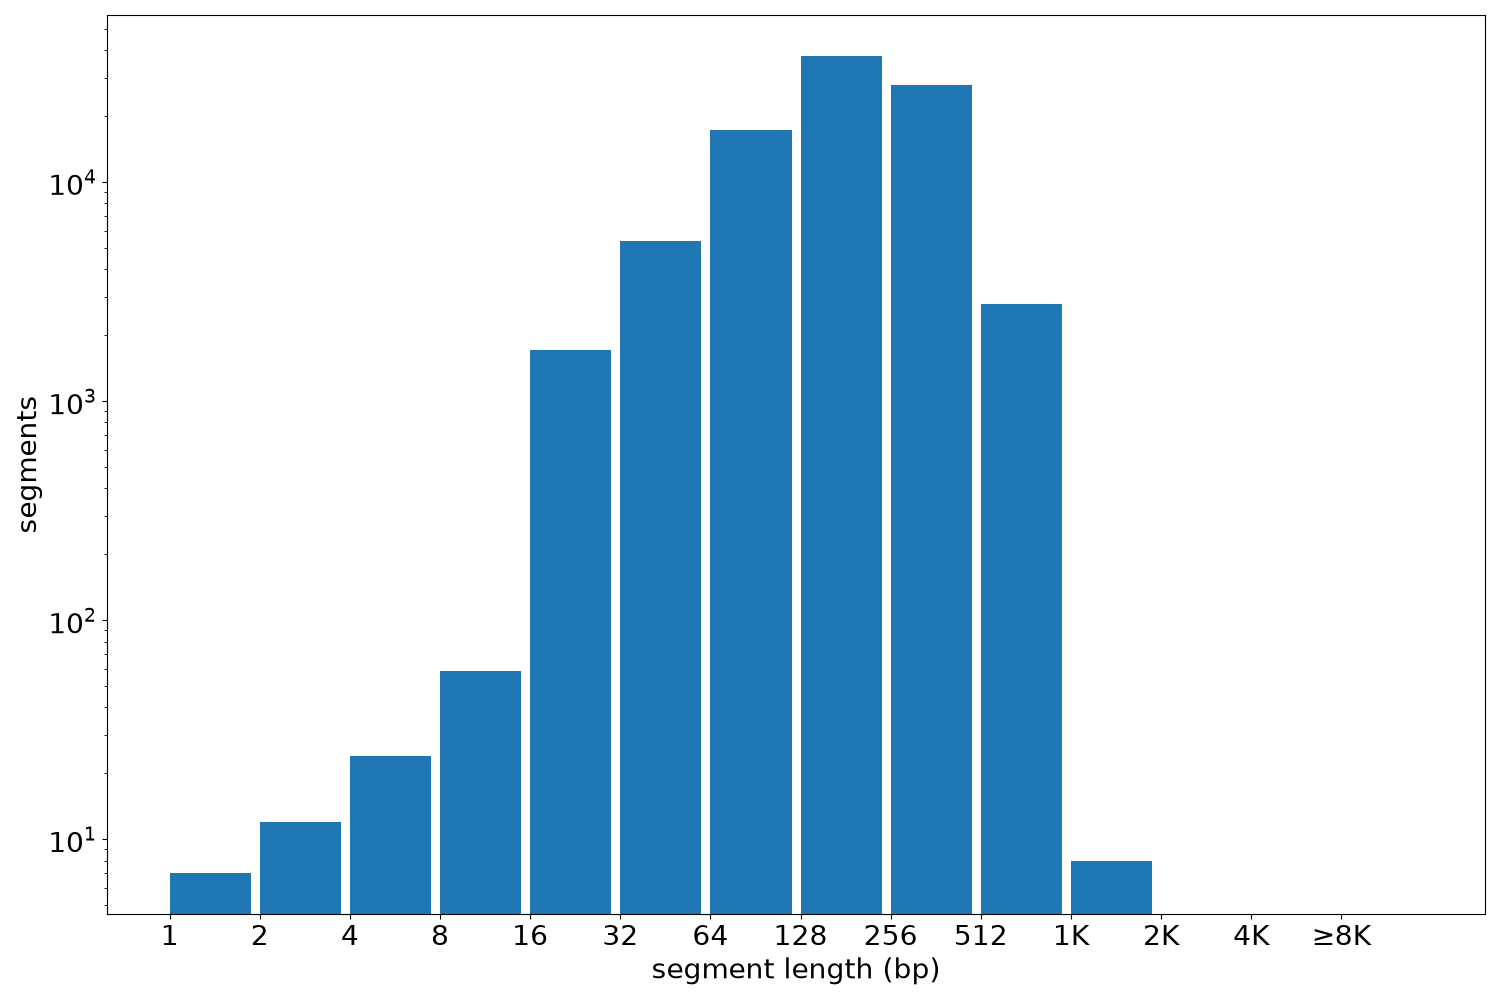
Segment lengths
| segments | min | max | mean | median | |
|---|---|---|---|---|---|
| segments | 92827 | 1 | 1377 | 218.8 | 200 |
Files
| Filename | Size | md5 |
|---|---|---|
| ENCFF485UZT.bed.gz | 907.54 KB | b30205504c98aedd8d199822f84fbce4 |
| ENCFF485UZT.tabix.bed.gz | 866.96 KB | 4fb222e84c13abe889c1dda8c599255a |
| ENCFF485UZT.tabix.bed.gz.tbi | 205.03 KB | f357a303e507b03aab2e27d79c518ae2 |
| genomic_resource.yaml | 1.99 KB | 4ffdfc077e32b793f6659a28f2739c2e |
| statistics/ |