Resource
| Id | DNase-seq/ENCSR360XIS |
|---|---|
| Type | position_score |
| Version | 0 |
| Summary | DNase-seq ENCSR360XIS [biosample_summary="Homo sapiens ecto neural progenitor cell originated from H9"] |
| Description |
status: archived biological_replicates: Rep 1 summary: female embryo (5 days) output_type: peaks audit_internal_action: Archived analysis {ENCAN330JXT|/analyses/ENCAN330JXT/} has in progress subobject quality standard {encode3-dnase|/quality-standards/encode3-dnase/} audit_warning: Signal Portion of Tags (SPOT) is a measure of enrichment, analogous to the commonly used fraction of reads in peaks metric. ENCODE processed alignment files {ENCFF939WNT|/files/ENCFF939WNT/} processed by DNase-seq ENCODE3 GRCh38 pipeline ({ENCPL202DNS|/pipelines/ENCPL202DNS/}) for GRCh38 assembly have a SPOT1 score of 0.39. According to ENCODE standards, SPOT1 score of 0.4 or higher is considered a product of high quality data. Any sample with a SPOT1 score <0.3 should be targeted for replacement with a higher quality sample, and a SPOT1 score of 0.25 is considered minimally acceptable SPOT1 score of 0.25 is considered minimally acceptable for rare and hard to find primary tissues. (See {ENCODE DNase-seq data standards|/data-standards/dnase-seq/}) audit_warning: Signal Portion of Tags (SPOT) is a measure of enrichment, analogous to the commonly used fraction of reads in peaks metric. ENCODE processed alignment files {ENCFF991DAZ|/files/ENCFF991DAZ/} processed by DNase-seq ENCODE3 GRCh38 pipeline ({ENCPL202DNS|/pipelines/ENCPL202DNS/}) for GRCh38 assembly have a SPOT1 score of 0.38. According to ENCODE standards, SPOT1 score of 0.4 or higher is considered a product of high quality data. Any sample with a SPOT1 score <0.3 should be targeted for replacement with a higher quality sample, and a SPOT1 score of 0.25 is considered minimally acceptable SPOT1 score of 0.25 is considered minimally acceptable for rare and hard to find primary tissues. (See {ENCODE DNase-seq data standards|/data-standards/dnase-seq/}) |
| Labels |
|
Scores (1)
| ID | Type | Default annotation | Description | Histogram | Range | Summary |
|---|---|---|---|---|---|---|
| DNase-seq_ENCSR360XIS | float |
DNase-seq_ENCSR360XIS |
DNase-seq ENCSR360XIS [biosample_summary="Homo sapiens ecto neural progenitor cell originated from H9"]
|
 |
[1, 1.35e+04] |
|
n counts base pairs; sd is the population standard deviation.
Coverage
| Chromosome | Covered positions | Covered % | Segments |
|---|---|---|---|
| all chromosomes | 43874474 | 1.36% | 291230 |
| chr1 | 3824169 | 1.54% | 25394 |
| chr2 | 3759999 | 1.55% | 24945 |
| chr3 | 2344737 | 1.18% | 15555 |
| chr4 | 1585714 | 0.83% | 10516 |
| chr5 | 2161790 | 1.19% | 14337 |
| chr6 | 2076591 | 1.22% | 13786 |
| chr7 | 1990580 | 1.25% | 13219 |
| chr8 | 1823698 | 1.26% | 12107 |
| chr9 | 1837322 | 1.33% | 12192 |
| chr10 | 2564744 | 1.92% | 16996 |
| chr11 | 2459999 | 1.82% | 16339 |
| chr12 | 2638606 | 1.98% | 17531 |
| chr13 | 1020607 | 0.89% | 6775 |
| chr14 | 1403524 | 1.31% | 9323 |
| chr15 | 1484237 | 1.46% | 9845 |
| chr16 | 1439368 | 1.59% | 9560 |
| chr17 | 2828052 | 3.40% | 18787 |
| chr18 | 1042709 | 1.30% | 6918 |
| chr19 | 1434102 | 2.45% | 9539 |
| chr20 | 1315719 | 2.04% | 8726 |
| chr21 | 586050 | 1.25% | 3890 |
| chr22 | 1138936 | 2.24% | 7566 |
| chrX | 1086371 | 0.70% | 7206 |
| chrY | 26850 | 0.05% | 178 |
| 3342 contigs with no values (129077085 bp) | 0 | 0.00% | 0 |
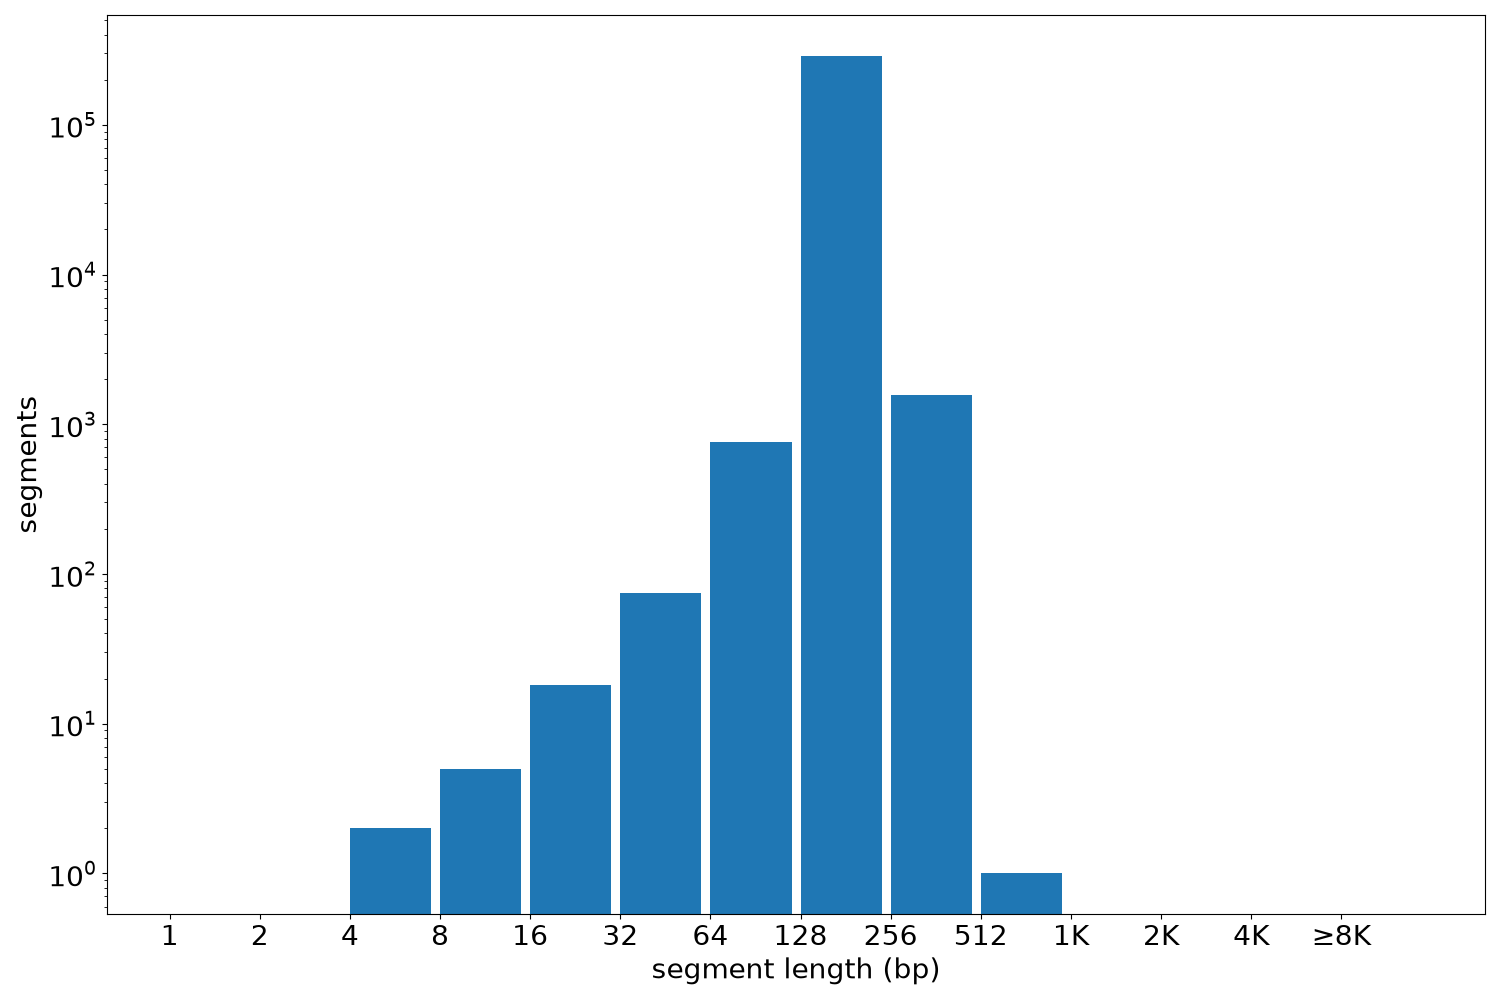
Segment lengths
| segments | min | max | mean | median | |
|---|---|---|---|---|---|
| segments | 291230 | 4 | 525 | 150.65 | 150 |
Files
| Filename | Size | md5 |
|---|---|---|
| ENCFF932KNY.bed.gz | 2.69 MB | 745c2fee3bd281aff6cb95f394c45ebd |
| ENCFF932KNY.tabix.bed.gz | 2.31 MB | c941013baeebd8ada6e53a8364724586 |
| ENCFF932KNY.tabix.bed.gz.tbi | 550.35 KB | c236181b9f03c22fa1f3ab97345c3421 |
| genomic_resource.yaml | 3.28 KB | 5b792e14303c8df19c4e342962bc3d08 |
| statistics/ |