Resource
| Id | DNase-seq/ENCSR340MRJ |
|---|---|
| Type | position_score |
| Version | 0 |
| Summary | DNase-seq ENCSR340MRJ [biosample_summary="Homo sapiens transverse colon tissue male adult (54 years)"] |
| Description |
status: released biological_replicates: Rep 1 summary: male adult (54 years) output_type: peaks audit_warning: Signal Portion of Tags (SPOT) is a measure of enrichment, analogous to the commonly used fraction of reads in peaks metric. ENCODE processed alignment files {ENCFF650EYC|/files/ENCFF650EYC/} processed by DNase-seq ENCODE4 v3.0.0-alpha.2 GRCh38 pipeline ({ENCPL848KLD|/pipelines/ENCPL848KLD/}) for GRCh38 assembly have a SPOT1 score of 0.37. According to ENCODE standards, SPOT1 score of 0.4 or higher is considered a product of high quality data. Any sample with a SPOT1 score <0.3 should be targeted for replacement with a higher quality sample, and a SPOT1 score of 0.25 is considered minimally acceptable SPOT1 score of 0.25 is considered minimally acceptable for rare and hard to find primary tissues. (See {ENCODE DNase-seq data standards|/data-standards/dnase-seq-encode4/}) |
| Labels |
|
Scores (1)
| ID | Type | Default annotation | Description | Histogram | Range | Summary |
|---|---|---|---|---|---|---|
| DNase-seq_ENCSR340MRJ | float |
DNase-seq_ENCSR340MRJ |
DNase-seq ENCSR340MRJ [biosample_summary="Homo sapiens transverse colon tissue male adult (54 years)"]
|
 |
[0.0336, 27.3] |
|
n counts base pairs; sd is the population standard deviation.
Coverage
| Chromosome | Covered positions | Covered % | Segments |
|---|---|---|---|
| all chromosomes | 41310971 | 1.28% | 212629 |
| chr1 | 3856005 | 1.55% | 20004 |
| chr2 | 3648687 | 1.51% | 18613 |
| chr3 | 2000348 | 1.01% | 10436 |
| chr4 | 1131289 | 0.59% | 5913 |
| chr5 | 1806061 | 0.99% | 9368 |
| chr6 | 1644218 | 0.96% | 8752 |
| chr7 | 2231519 | 1.40% | 11435 |
| chr8 | 1613779 | 1.11% | 8299 |
| chr9 | 1856894 | 1.34% | 9613 |
| chr10 | 2384370 | 1.78% | 12045 |
| chr11 | 2225366 | 1.65% | 11156 |
| chr12 | 1736372 | 1.30% | 9137 |
| chr13 | 773115 | 0.68% | 3994 |
| chr14 | 1477032 | 1.38% | 7468 |
| chr15 | 1690765 | 1.66% | 8747 |
| chr16 | 1831972 | 2.03% | 9437 |
| chr17 | 2539814 | 3.05% | 13046 |
| chr18 | 717576 | 0.89% | 3758 |
| chr19 | 1551786 | 2.65% | 8039 |
| chr20 | 1514992 | 2.35% | 7817 |
| chr21 | 758389 | 1.62% | 3768 |
| chr22 | 1647527 | 3.24% | 8185 |
| chrX | 652010 | 0.42% | 3468 |
| chrY | 21085 | 0.04% | 131 |
| 3342 contigs with no values (129077085 bp) | 0 | 0.00% | 0 |
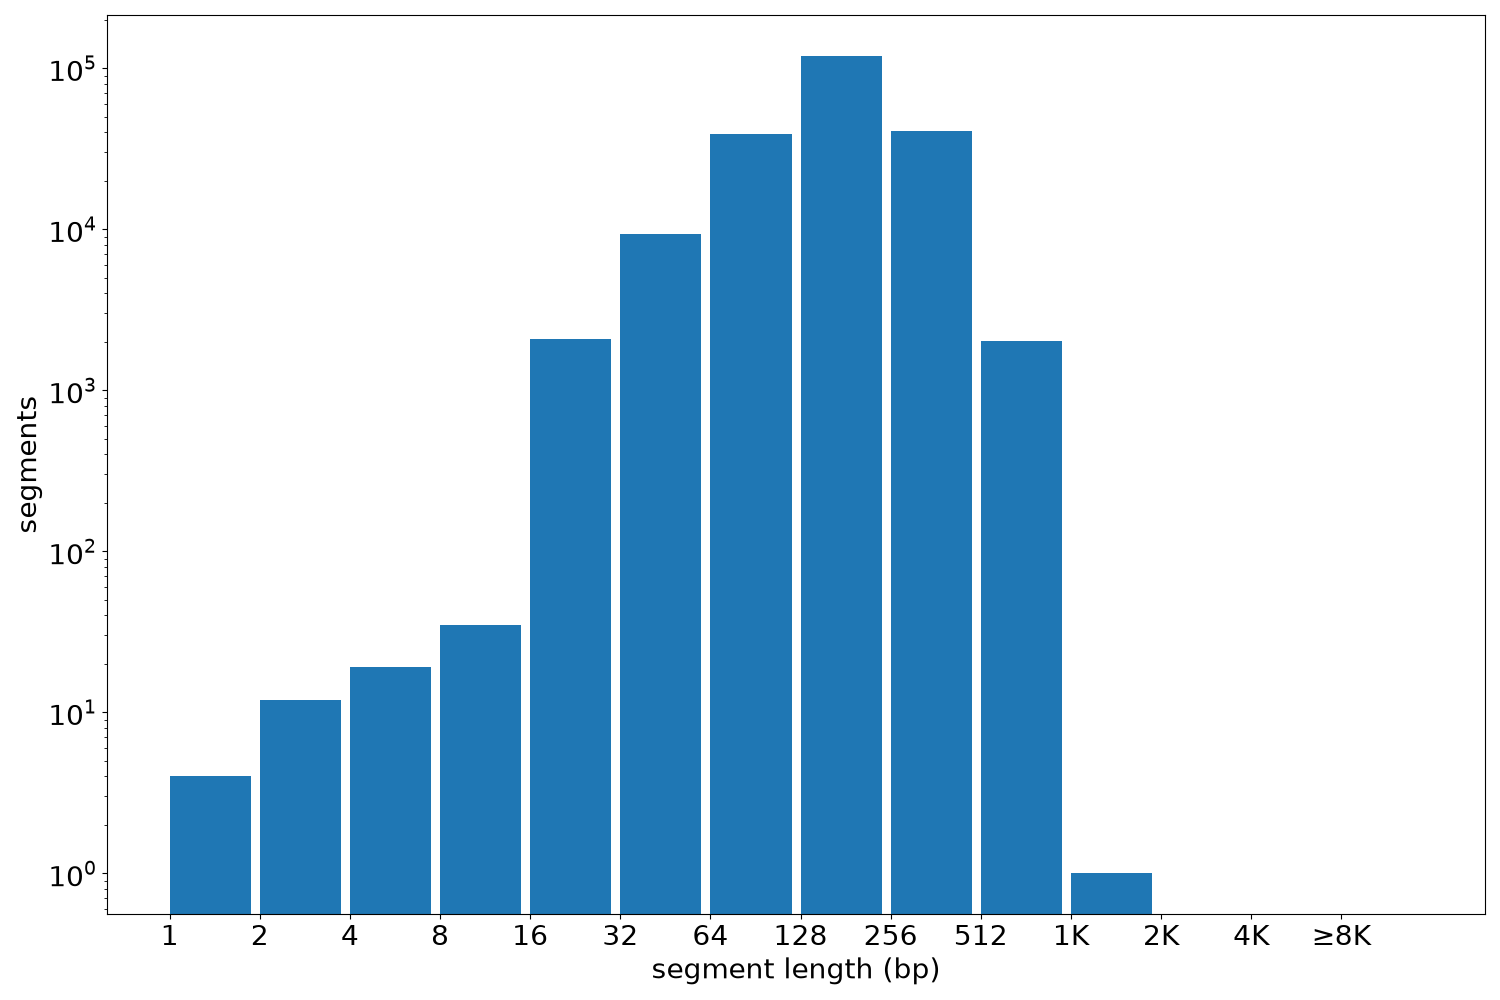
Segment lengths
| segments | min | max | mean | median | |
|---|---|---|---|---|---|
| segments | 212629 | 1 | 1080 | 194.29 | 180 |
Files
| Filename | Size | md5 |
|---|---|---|
| ENCFF690KZJ.bed.gz | 2.01 MB | a361602f43ad36fa90d5a86acf035231 |
| ENCFF690KZJ.tabix.bed.gz | 1.9 MB | 263b55d061eb5252869ca70716afea9f |
| ENCFF690KZJ.tabix.bed.gz.tbi | 340.04 KB | 83a315cc36584ae1e186674a132fce4a |
| genomic_resource.yaml | 2.04 KB | 45c4e67c37bc99660ee51baf54d3a7bd |
| statistics/ |