Resource
| Id | DNase-seq/ENCSR330JXM |
|---|---|
| Type | position_score |
| Version | 0 |
| Summary | DNase-seq ENCSR330JXM [biosample_summary="Homo sapiens brain organoid, 90 days post differentiation"] |
| Description |
status: released biological_replicates: Rep 1 summary: brain organoid 90 days post differentiation output_type: peaks audit_error: Signal Portion of Tags (SPOT) is a measure of enrichment, analogous to the commonly used fraction of reads in peaks metric. ENCODE processed alignment files {ENCFF424NSY|/files/ENCFF424NSY/} processed by DNase-seq ENCODE4 v3.0.0 GRCh38 pipeline ({ENCPL848KLD|/pipelines/ENCPL848KLD/}) for GRCh38 assembly have a SPOT1 score of 0.22. According to ENCODE standards, SPOT1 score of 0.4 or higher is considered a product of high quality data. Any sample with a SPOT1 score <0.3 should be targeted for replacement with a higher quality sample, and a SPOT1 score of 0.25 is considered minimally acceptable SPOT1 score of 0.25 is considered minimally acceptable for rare and hard to find primary tissues. (See {ENCODE DNase-seq data standards|/data-standards/dnase-seq-encode4/}) |
| Labels |
|
Scores (1)
| ID | Type | Default annotation | Description | Histogram | Range | Summary |
|---|---|---|---|---|---|---|
| DNase-seq_ENCSR330JXM | float |
DNase-seq_ENCSR330JXM |
DNase-seq ENCSR330JXM [biosample_summary="Homo sapiens brain organoid, 90 days post differentiation"]
|
 |
[0.0568, 12.4] |
|
n counts base pairs; sd is the population standard deviation.
Coverage
| Chromosome | Covered positions | Covered % | Segments |
|---|---|---|---|
| all chromosomes | 9258793 | 0.29% | 49055 |
| chr1 | 893905 | 0.36% | 4705 |
| chr2 | 670010 | 0.28% | 3624 |
| chr3 | 543461 | 0.27% | 2870 |
| chr4 | 408279 | 0.21% | 2158 |
| chr5 | 482359 | 0.27% | 2591 |
| chr6 | 533045 | 0.31% | 2792 |
| chr7 | 443506 | 0.28% | 2407 |
| chr8 | 407729 | 0.28% | 2151 |
| chr9 | 394949 | 0.29% | 2112 |
| chr10 | 416421 | 0.31% | 2199 |
| chr11 | 508927 | 0.38% | 2700 |
| chr12 | 477754 | 0.36% | 2469 |
| chr13 | 211129 | 0.18% | 1135 |
| chr14 | 320907 | 0.30% | 1680 |
| chr15 | 296168 | 0.29% | 1592 |
| chr16 | 335761 | 0.37% | 1786 |
| chr17 | 475368 | 0.57% | 2489 |
| chr18 | 183489 | 0.23% | 969 |
| chr19 | 485642 | 0.83% | 2433 |
| chr20 | 246842 | 0.38% | 1355 |
| chr21 | 87757 | 0.19% | 472 |
| chr22 | 189876 | 0.37% | 1034 |
| chrX | 237441 | 0.15% | 1288 |
| chrY | 8068 | 0.01% | 44 |
| 3342 contigs with no values (129077085 bp) | 0 | 0.00% | 0 |
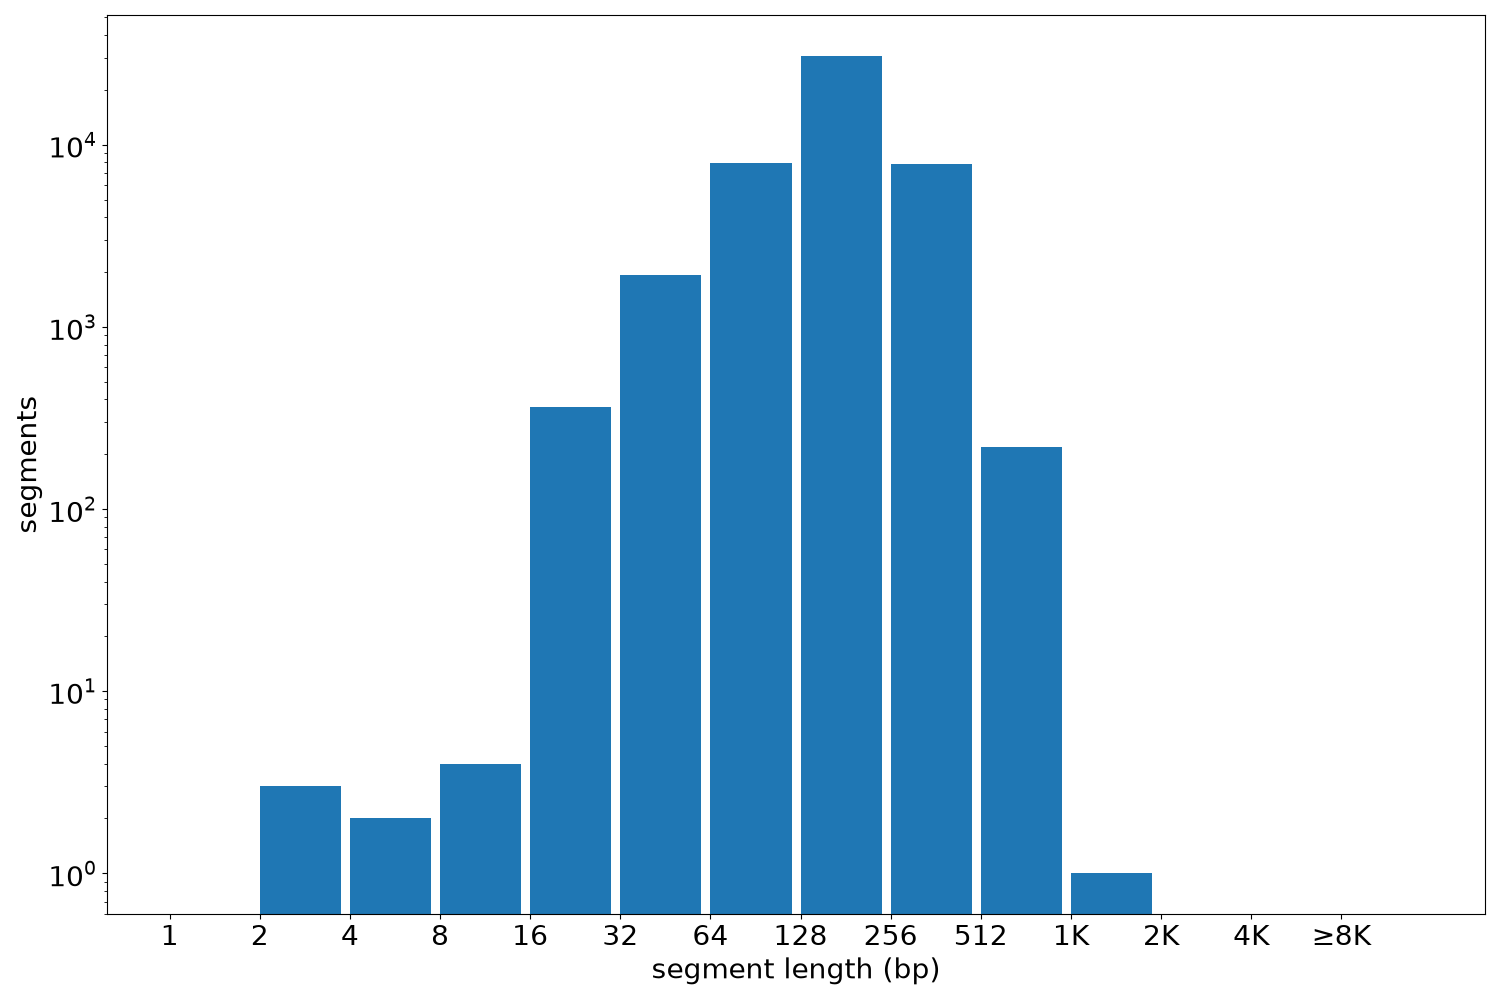
Segment lengths
| segments | min | max | mean | median | |
|---|---|---|---|---|---|
| segments | 49055 | 2 | 1100 | 188.74 | 180 |
Files
| Filename | Size | md5 |
|---|---|---|
| ENCFF966AQE.bed.gz | 533.07 KB | 42a733a3828c6eb16afb23856ea28b7b |
| ENCFF966AQE.tabix.bed.gz | 490.33 KB | 861effa0c2da8ee28f59725305e889bb |
| ENCFF966AQE.tabix.bed.gz.tbi | 241.52 KB | 47947fa5d48451eb669c88c937107480 |
| genomic_resource.yaml | 2.08 KB | 195e3b7552f471ad651ee8efdad5197e |
| statistics/ |