Resource
| Id | DNase-seq/ENCSR324OTS |
|---|---|
| Type | position_score |
| Version | 0 |
| Summary | DNase-seq ENCSR324OTS [biosample_summary="Homo sapiens CD4-positive, alpha-beta T cell female adult (39 years) treated with 100 ng/mL Interleukin-2 for 4 hours"] |
| Description |
status: released biological_replicates: Rep 1 summary: female adult (39 years) treated with 100 ng/mL Interleukin-2 for 4 hours output_type: peaks audit_warning: Signal Portion of Tags (SPOT) is a measure of enrichment, analogous to the commonly used fraction of reads in peaks metric. ENCODE processed alignment files {ENCFF127SBE|/files/ENCFF127SBE/} processed by DNase-seq ENCODE4 v3.0.0-alpha.2 GRCh38 pipeline ({ENCPL848KLD|/pipelines/ENCPL848KLD/}) for GRCh38 assembly have a SPOT1 score of 0.37. According to ENCODE standards, SPOT1 score of 0.4 or higher is considered a product of high quality data. Any sample with a SPOT1 score <0.3 should be targeted for replacement with a higher quality sample, and a SPOT1 score of 0.25 is considered minimally acceptable SPOT1 score of 0.25 is considered minimally acceptable for rare and hard to find primary tissues. (See {ENCODE DNase-seq data standards|/data-standards/dnase-seq-encode4/}) |
| Labels |
|
Scores (1)
| ID | Type | Default annotation | Description | Histogram | Range | Summary |
|---|---|---|---|---|---|---|
| DNase-seq_ENCSR324OTS | float |
DNase-seq_ENCSR324OTS |
DNase-seq ENCSR324OTS [biosample_summary="Homo sapiens CD4-positive, alpha-beta T cell female adult (39 years) treated with 100 ng/mL Interleukin-2 for 4 hours"]
|
 |
[0.0692, 46] |
|
n counts base pairs; sd is the population standard deviation.
Coverage
| Chromosome | Covered positions | Covered % | Segments |
|---|---|---|---|
| all chromosomes | 16239315 | 0.50% | 84272 |
| chr1 | 1615902 | 0.65% | 8335 |
| chr2 | 1219633 | 0.50% | 6323 |
| chr3 | 961208 | 0.48% | 4980 |
| chr4 | 613232 | 0.32% | 3183 |
| chr5 | 773696 | 0.43% | 4031 |
| chr6 | 1002211 | 0.59% | 5154 |
| chr7 | 756490 | 0.47% | 3933 |
| chr8 | 641607 | 0.44% | 3370 |
| chr9 | 636581 | 0.46% | 3346 |
| chr10 | 778138 | 0.58% | 3990 |
| chr11 | 801088 | 0.59% | 4151 |
| chr12 | 840100 | 0.63% | 4368 |
| chr13 | 370938 | 0.32% | 1922 |
| chr14 | 579126 | 0.54% | 3039 |
| chr15 | 515704 | 0.51% | 2707 |
| chr16 | 601416 | 0.67% | 3109 |
| chr17 | 875981 | 1.05% | 4536 |
| chr18 | 278758 | 0.35% | 1444 |
| chr19 | 839135 | 1.43% | 4285 |
| chr20 | 439099 | 0.68% | 2328 |
| chr21 | 197047 | 0.42% | 1033 |
| chr22 | 365152 | 0.72% | 1899 |
| chrX | 509469 | 0.33% | 2659 |
| chrY | 27604 | 0.05% | 147 |
| 3342 contigs with no values (129077085 bp) | 0 | 0.00% | 0 |
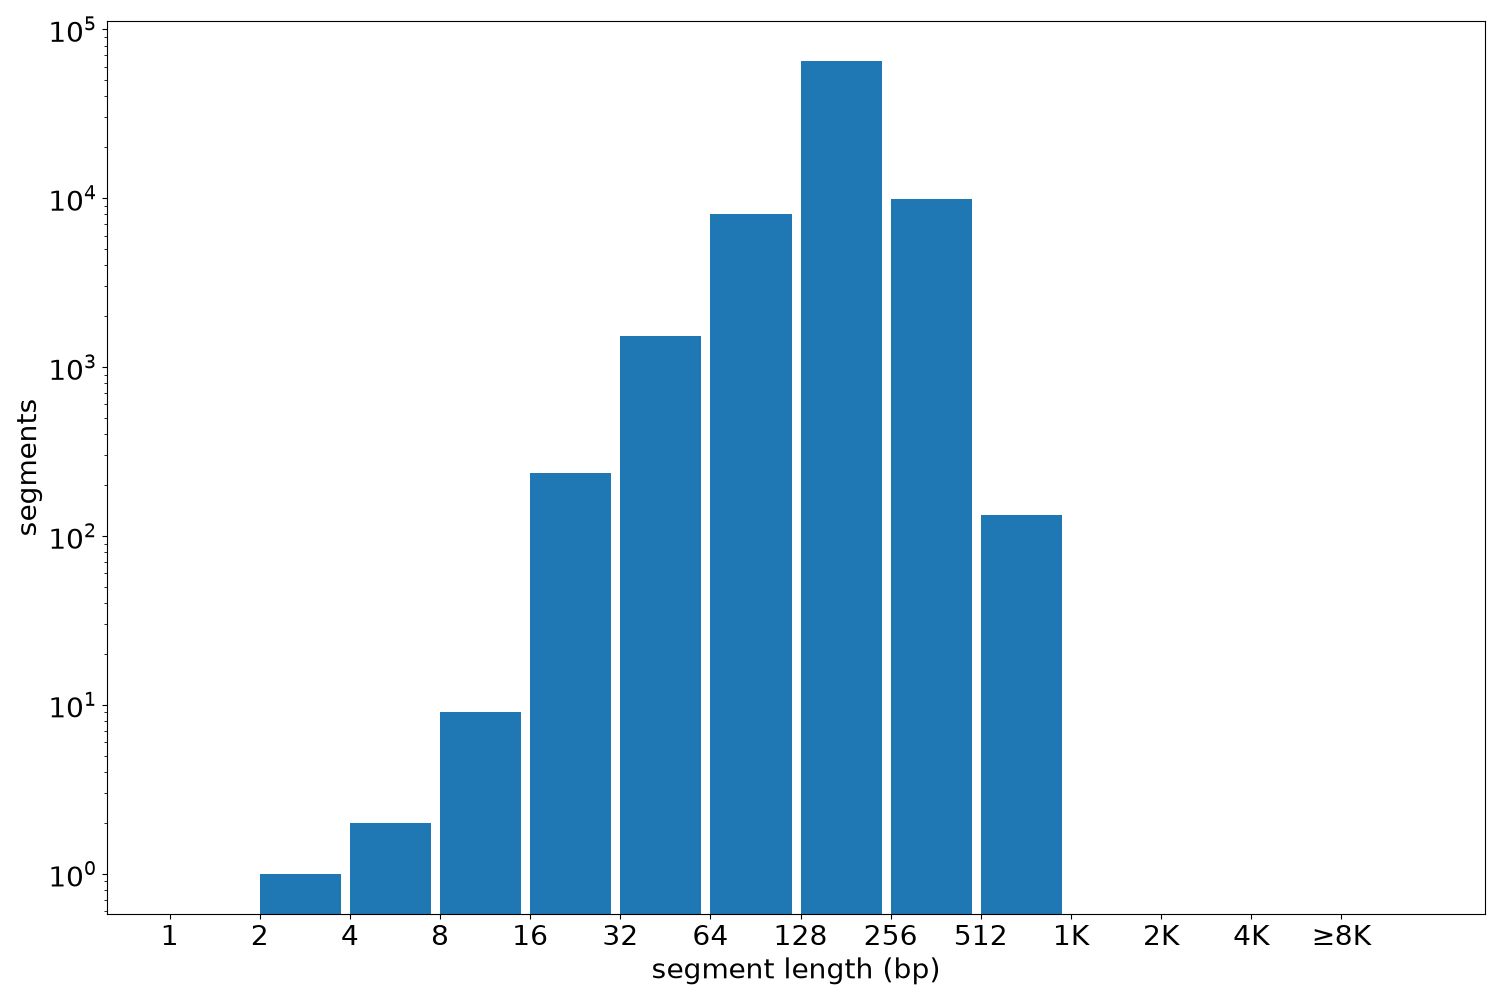
Segment lengths
| segments | min | max | mean | median | |
|---|---|---|---|---|---|
| segments | 84272 | 3 | 980 | 192.7 | 181 |
Files
| Filename | Size | md5 |
|---|---|---|
| ENCFF254WJV.bed.gz | 942.3 KB | 704750e6c302e09d1feba54373c2cd01 |
| ENCFF254WJV.tabix.bed.gz | 861.6 KB | 691f2a3cb3af1cb0077cb855de71ca32 |
| ENCFF254WJV.tabix.bed.gz.tbi | 326.27 KB | 4a252c52c6627936787a3ddb053c7a67 |
| genomic_resource.yaml | 2.33 KB | 79b69b64983d8dcce5b3fa9e4ae9b581 |
| statistics/ |