Resource
| Id | DNase-seq/ENCSR306BHE |
|---|---|
| Type | position_score |
| Version | 0 |
| Summary | DNase-seq ENCSR306BHE [biosample_summary="Homo sapiens RWPE2"] |
| Description |
status: released biological_replicates: Rep 2 summary: output_type: peaks audit_warning: Signal Portion of Tags (SPOT) is a measure of enrichment, analogous to the commonly used fraction of reads in peaks metric. ENCODE processed alignment files {ENCFF407ORW|/files/ENCFF407ORW/} processed by DNase-seq ENCODE4 v3.0.0-alpha.2 GRCh38 pipeline ({ENCPL848KLD|/pipelines/ENCPL848KLD/}) for GRCh38 assembly have a SPOT1 score of 0.36. According to ENCODE standards, SPOT1 score of 0.4 or higher is considered a product of high quality data. Any sample with a SPOT1 score <0.3 should be targeted for replacement with a higher quality sample, and a SPOT1 score of 0.25 is considered minimally acceptable SPOT1 score of 0.25 is considered minimally acceptable for rare and hard to find primary tissues. (See {ENCODE DNase-seq data standards|/data-standards/dnase-seq-encode4/}) |
| Labels |
|
Scores (1)
| ID | Type | Default annotation | Description | Histogram | Range | Summary |
|---|---|---|---|---|---|---|
| DNase-seq_ENCSR306BHE | float |
DNase-seq_ENCSR306BHE |
DNase-seq ENCSR306BHE [biosample_summary="Homo sapiens RWPE2"]
|
 |
[0.0469, 19.4] |
|
n counts base pairs; sd is the population standard deviation.
Coverage
| Chromosome | Covered positions | Covered % | Segments |
|---|---|---|---|
| all chromosomes | 23277585 | 0.72% | 116346 |
| chr1 | 1472460 | 0.59% | 7493 |
| chr2 | 1316246 | 0.54% | 6771 |
| chr3 | 892395 | 0.45% | 4635 |
| chr4 | 689485 | 0.36% | 3569 |
| chr5 | 1513891 | 0.83% | 7385 |
| chr6 | 609611 | 0.36% | 3286 |
| chr7 | 991114 | 0.62% | 4982 |
| chr8 | 872698 | 0.60% | 4263 |
| chr9 | 938045 | 0.68% | 4689 |
| chr10 | 886112 | 0.66% | 4524 |
| chr11 | 1188483 | 0.88% | 5853 |
| chr12 | 758360 | 0.57% | 3932 |
| chr13 | 290876 | 0.25% | 1523 |
| chr14 | 1215884 | 1.14% | 5873 |
| chr15 | 1859379 | 1.82% | 9161 |
| chr16 | 1032701 | 1.14% | 5279 |
| chr17 | 1271523 | 1.53% | 6340 |
| chr18 | 254007 | 0.32% | 1339 |
| chr19 | 752055 | 1.28% | 3955 |
| chr20 | 3046058 | 4.73% | 14378 |
| chr21 | 363867 | 0.78% | 1778 |
| chr22 | 705101 | 1.39% | 3456 |
| chrX | 337305 | 0.22% | 1757 |
| chrY | 19929 | 0.03% | 125 |
| 3342 contigs with no values (129077085 bp) | 0 | 0.00% | 0 |
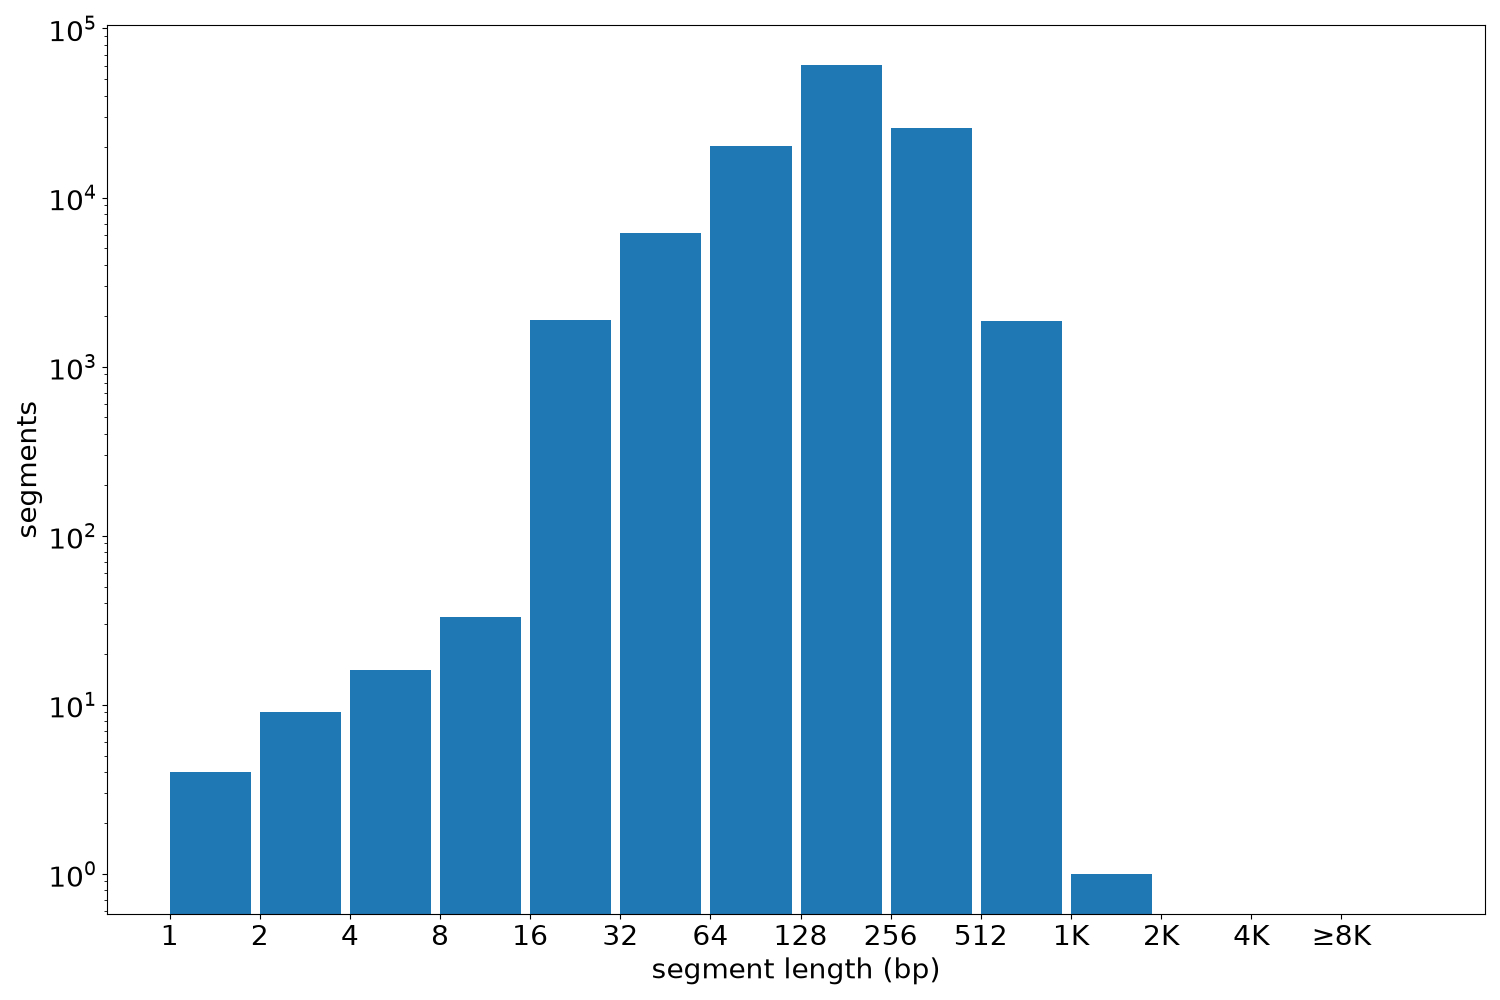
Segment lengths
| segments | min | max | mean | median | |
|---|---|---|---|---|---|
| segments | 116346 | 1 | 1060 | 200.07 | 180 |
Files
| Filename | Size | md5 |
|---|---|---|
| ENCFF939OBM.bed.gz | 1.13 MB | e4ba3a533a721b5b86d260cf671bfea7 |
| ENCFF939OBM.tabix.bed.gz | 1.07 MB | 2bce5683fe309c293811c8a567c2ef68 |
| ENCFF939OBM.tabix.bed.gz.tbi | 244.65 KB | 19924b25a036ebaa0d9e8d32bf5b33b0 |
| genomic_resource.yaml | 1.91 KB | 6379640e7256e2db27494400d398b6eb |
| statistics/ |