Resource
| Id | DNase-seq/ENCSR291HMM |
|---|---|
| Type | position_score |
| Version | 0 |
| Summary | DNase-seq ENCSR291HMM [biosample_summary="Homo sapiens naive thymus-derived CD8-positive, alpha-beta T cell"] |
| Description |
status: released biological_replicates: Rep 1 summary: output_type: peaks audit_warning: Signal Portion of Tags (SPOT) is a measure of enrichment, analogous to the commonly used fraction of reads in peaks metric. ENCODE processed alignment files {ENCFF442AXX|/files/ENCFF442AXX/} processed by DNase-seq ENCODE4 v3.0.0 GRCh38 pipeline ({ENCPL848KLD|/pipelines/ENCPL848KLD/}) for GRCh38 assembly have a SPOT1 score of 0.37. According to ENCODE standards, SPOT1 score of 0.4 or higher is considered a product of high quality data. Any sample with a SPOT1 score <0.3 should be targeted for replacement with a higher quality sample, and a SPOT1 score of 0.25 is considered minimally acceptable SPOT1 score of 0.25 is considered minimally acceptable for rare and hard to find primary tissues. (See {ENCODE DNase-seq data standards|/data-standards/dnase-seq-encode4/}) |
| Labels |
|
Scores (1)
| ID | Type | Default annotation | Description | Histogram | Range | Summary |
|---|---|---|---|---|---|---|
| DNase-seq_ENCSR291HMM | float |
DNase-seq_ENCSR291HMM |
DNase-seq ENCSR291HMM [biosample_summary="Homo sapiens naive thymus-derived CD8-positive, alpha-beta T cell"]
|
 |
[0.0665, 27.4] |
|
n counts base pairs; sd is the population standard deviation.
Coverage
| Chromosome | Covered positions | Covered % | Segments |
|---|---|---|---|
| all chromosomes | 17092786 | 0.53% | 72960 |
| chr1 | 1696274 | 0.68% | 7143 |
| chr2 | 1327448 | 0.55% | 5642 |
| chr3 | 921550 | 0.46% | 3951 |
| chr4 | 649249 | 0.34% | 2798 |
| chr5 | 796149 | 0.44% | 3413 |
| chr6 | 1041233 | 0.61% | 4337 |
| chr7 | 829032 | 0.52% | 3539 |
| chr8 | 644012 | 0.44% | 2797 |
| chr9 | 677789 | 0.49% | 2883 |
| chr10 | 758259 | 0.57% | 3259 |
| chr11 | 889717 | 0.66% | 3798 |
| chr12 | 893775 | 0.67% | 3733 |
| chr13 | 410525 | 0.36% | 1702 |
| chr14 | 597008 | 0.56% | 2533 |
| chr15 | 549021 | 0.54% | 2412 |
| chr16 | 608132 | 0.67% | 2669 |
| chr17 | 993754 | 1.19% | 4218 |
| chr18 | 284044 | 0.35% | 1233 |
| chr19 | 951369 | 1.62% | 3989 |
| chr20 | 448585 | 0.70% | 1993 |
| chr21 | 206072 | 0.44% | 890 |
| chr22 | 384650 | 0.76% | 1682 |
| chrX | 534949 | 0.34% | 2345 |
| chrY | 190 | <0.01% | 1 |
| 3342 contigs with no values (129077085 bp) | 0 | 0.00% | 0 |
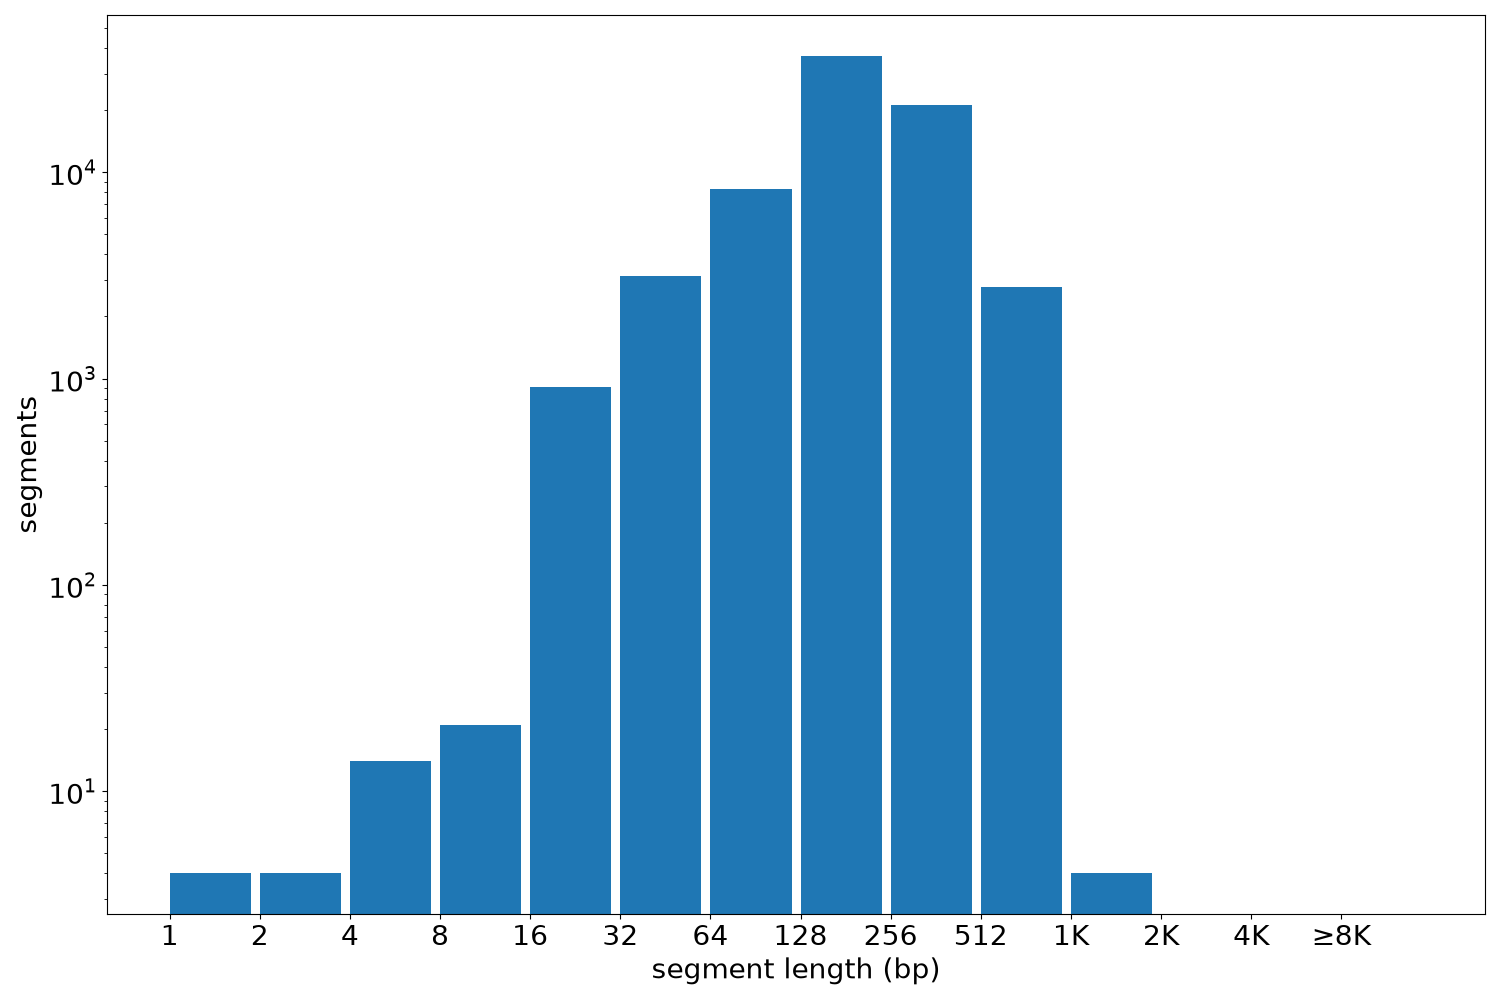
Segment lengths
| segments | min | max | mean | median | |
|---|---|---|---|---|---|
| segments | 72960 | 1 | 1240 | 234.28 | 200 |
Files
| Filename | Size | md5 |
|---|---|---|
| ENCFF386GNZ.bed.gz | 781.74 KB | 5632cb40414ab68f4b3de2628ebfd75c |
| ENCFF386GNZ.tabix.bed.gz | 735.82 KB | f8fafd6e3d196d5b81b89fa3a20f7d45 |
| ENCFF386GNZ.tabix.bed.gz.tbi | 292.6 KB | 002b92a6049f26befac2ecfb33bec147 |
| genomic_resource.yaml | 2.05 KB | e8092bb551c7b8da8920b7f897701a4e |
| statistics/ |