Resource
| Id | DNase-seq/ENCSR269SIA |
|---|---|
| Type | position_score |
| Version | 0 |
| Summary | DNase-seq ENCSR269SIA [biosample_summary="Homo sapiens G401"] |
| Description |
status: released biological_replicates: Rep 1 summary: output_type: peaks audit_warning: Signal Portion of Tags (SPOT) is a measure of enrichment, analogous to the commonly used fraction of reads in peaks metric. ENCODE processed alignment files {ENCFF671CNQ|/files/ENCFF671CNQ/} processed by DNase-seq ENCODE4 v3.0.0-alpha.2 GRCh38 pipeline ({ENCPL848KLD|/pipelines/ENCPL848KLD/}) for GRCh38 assembly have a SPOT1 score of 0.39. According to ENCODE standards, SPOT1 score of 0.4 or higher is considered a product of high quality data. Any sample with a SPOT1 score <0.3 should be targeted for replacement with a higher quality sample, and a SPOT1 score of 0.25 is considered minimally acceptable SPOT1 score of 0.25 is considered minimally acceptable for rare and hard to find primary tissues. (See {ENCODE DNase-seq data standards|/data-standards/dnase-seq-encode4/}) |
| Labels |
|
Scores (1)
| ID | Type | Default annotation | Description | Histogram | Range | Summary |
|---|---|---|---|---|---|---|
| DNase-seq_ENCSR269SIA | float |
DNase-seq_ENCSR269SIA |
DNase-seq ENCSR269SIA [biosample_summary="Homo sapiens G401"]
|
 |
[0.0263, 26] |
|
n counts base pairs; sd is the population standard deviation.
Coverage
| Chromosome | Covered positions | Covered % | Segments |
|---|---|---|---|
| all chromosomes | 37339313 | 1.16% | 170820 |
| chr1 | 3463001 | 1.39% | 15660 |
| chr2 | 2713560 | 1.12% | 12431 |
| chr3 | 2426593 | 1.22% | 11088 |
| chr4 | 1693006 | 0.89% | 7693 |
| chr5 | 2177602 | 1.20% | 9882 |
| chr6 | 2142668 | 1.25% | 9730 |
| chr7 | 2015359 | 1.26% | 9254 |
| chr8 | 1769896 | 1.22% | 8042 |
| chr9 | 1642491 | 1.19% | 7594 |
| chr10 | 1704117 | 1.27% | 7811 |
| chr11 | 1967158 | 1.46% | 8977 |
| chr12 | 1849187 | 1.39% | 8360 |
| chr13 | 1012255 | 0.89% | 4548 |
| chr14 | 1222616 | 1.14% | 5554 |
| chr15 | 1248261 | 1.22% | 5785 |
| chr16 | 1224761 | 1.36% | 5728 |
| chr17 | 1697826 | 2.04% | 7848 |
| chr18 | 902820 | 1.12% | 4084 |
| chr19 | 1301942 | 2.22% | 5953 |
| chr20 | 979117 | 1.52% | 4594 |
| chr21 | 390181 | 0.84% | 1774 |
| chr22 | 773616 | 1.52% | 3613 |
| chrX | 964272 | 0.62% | 4550 |
| chrY | 57008 | 0.10% | 267 |
| 3342 contigs with no values (129077085 bp) | 0 | 0.00% | 0 |
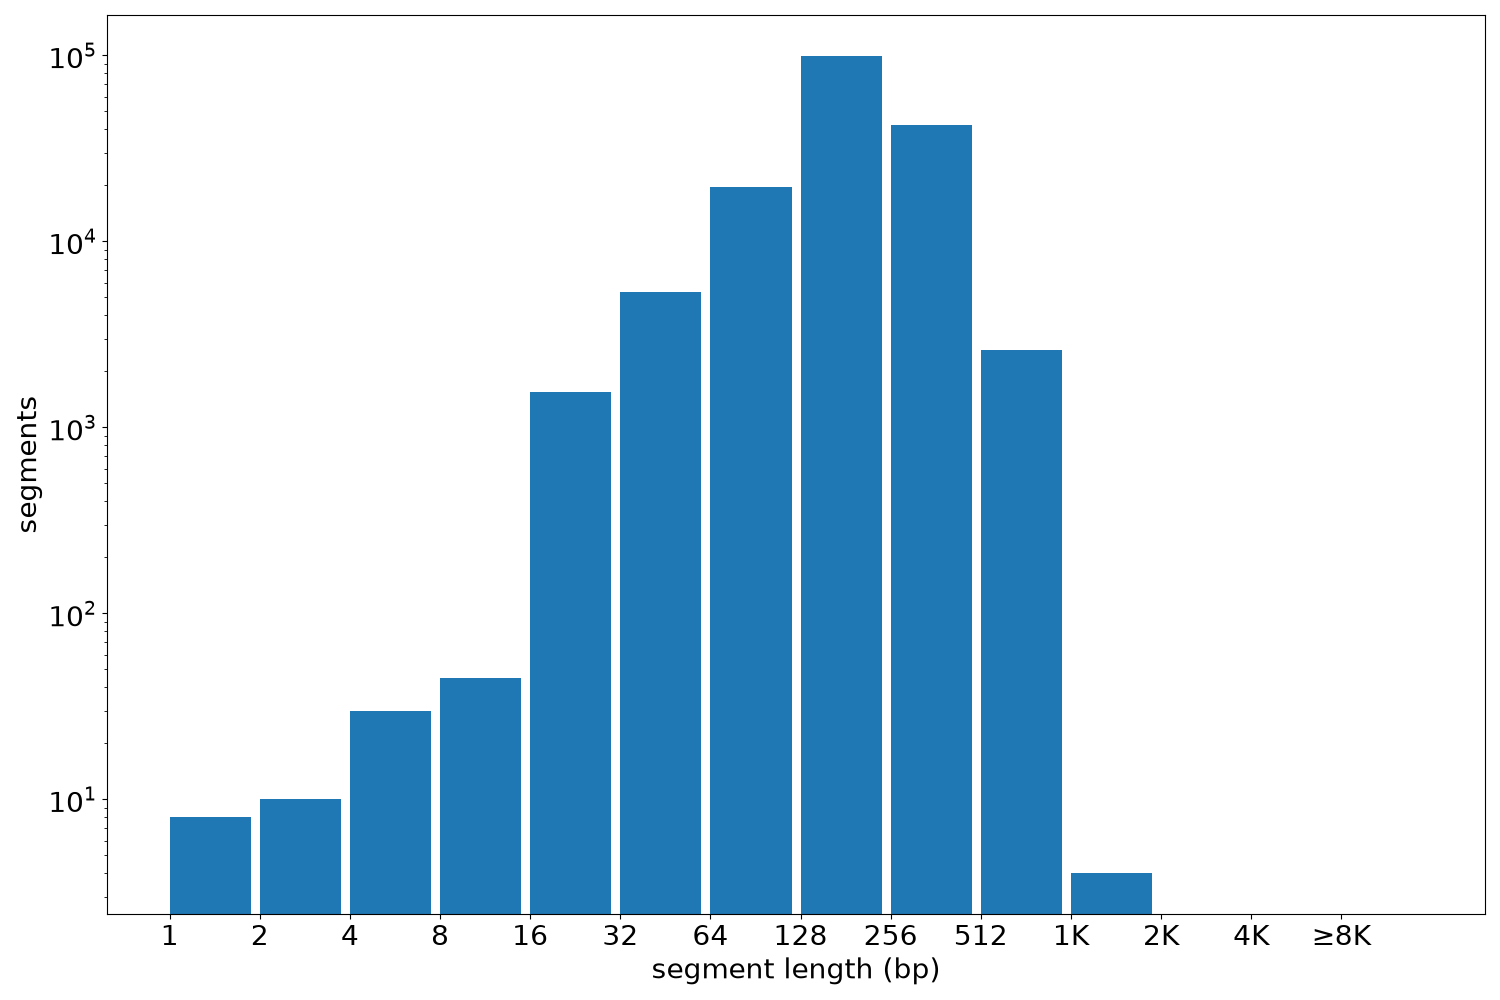
Segment lengths
| segments | min | max | mean | median | |
|---|---|---|---|---|---|
| segments | 170820 | 1 | 1119 | 218.59 | 200 |
Files
| Filename | Size | md5 |
|---|---|---|
| ENCFF309YIK.bed.gz | 1.81 MB | 0271a0d29ff8dae9f0b3abcb140180c0 |
| ENCFF309YIK.tabix.bed.gz | 1.68 MB | 7a3013d96f7d2028d48b0733e9e58f85 |
| ENCFF309YIK.tabix.bed.gz.tbi | 517.8 KB | 77a6e8e57019ae01b740f3811531942a |
| genomic_resource.yaml | 1.91 KB | e25760861de9994b3ea060b210656d2b |
| statistics/ |