Resource
| Id | DNase-seq/ENCSR224FOA |
|---|---|
| Type | position_score |
| Version | 0 |
| Summary | DNase-seq ENCSR224FOA [biosample_summary="Homo sapiens islet precursor cell"] |
| Description |
status: released biological_replicates: Rep 2 summary: female embryo (5 days) output_type: peaks audit_internal_action: Archived analysis {ENCAN900MPY|/analyses/ENCAN900MPY/} has in progress subobject quality standard {encode3-dnase|/quality-standards/encode3-dnase/} audit_warning: Signal Portion of Tags (SPOT) is a measure of enrichment, analogous to the commonly used fraction of reads in peaks metric. ENCODE processed alignment files {ENCFF957MNB|/files/ENCFF957MNB/} processed by DNase-seq ENCODE3 GRCh38 pipeline ({ENCPL202DNS|/pipelines/ENCPL202DNS/}) for GRCh38 assembly have a SPOT1 score of 0.39. According to ENCODE standards, SPOT1 score of 0.4 or higher is considered a product of high quality data. Any sample with a SPOT1 score <0.3 should be targeted for replacement with a higher quality sample, and a SPOT1 score of 0.25 is considered minimally acceptable SPOT1 score of 0.25 is considered minimally acceptable for rare and hard to find primary tissues. (See {ENCODE DNase-seq data standards|/data-standards/dnase-seq/}) |
| Labels |
|
Scores (1)
| ID | Type | Default annotation | Description | Histogram | Range | Summary |
|---|---|---|---|---|---|---|
| DNase-seq_ENCSR224FOA | float |
DNase-seq_ENCSR224FOA |
DNase-seq ENCSR224FOA [biosample_summary="Homo sapiens islet precursor cell"]
|
 |
[1, 2.45e+05] |
|
n counts base pairs; sd is the population standard deviation.
Coverage
| Chromosome | Covered positions | Covered % | Segments |
|---|---|---|---|
| all chromosomes | 74105057 | 2.30% | 492935 |
| chr1 | 6391376 | 2.57% | 42499 |
| chr2 | 6346252 | 2.62% | 42217 |
| chr3 | 4217810 | 2.13% | 28070 |
| chr4 | 3067860 | 1.61% | 20420 |
| chr5 | 3929616 | 2.16% | 26138 |
| chr6 | 3651903 | 2.14% | 24308 |
| chr7 | 3591276 | 2.25% | 23863 |
| chr8 | 3325060 | 2.29% | 22107 |
| chr9 | 3115124 | 2.25% | 20719 |
| chr10 | 4152608 | 3.10% | 27630 |
| chr11 | 3790711 | 2.81% | 25209 |
| chr12 | 4427669 | 3.32% | 29464 |
| chr13 | 1876279 | 1.64% | 12475 |
| chr14 | 2303587 | 2.15% | 15325 |
| chr15 | 2460192 | 2.41% | 16368 |
| chr16 | 2431323 | 2.69% | 16168 |
| chr17 | 4315659 | 5.18% | 28714 |
| chr18 | 1722229 | 2.14% | 11453 |
| chr19 | 2039892 | 3.48% | 13572 |
| chr20 | 2203856 | 3.42% | 14659 |
| chr21 | 951867 | 2.04% | 6336 |
| chr22 | 1705471 | 3.36% | 11347 |
| chrX | 2043371 | 1.31% | 13580 |
| chrY | 44066 | 0.08% | 294 |
| 3342 contigs with no values (129077085 bp) | 0 | 0.00% | 0 |
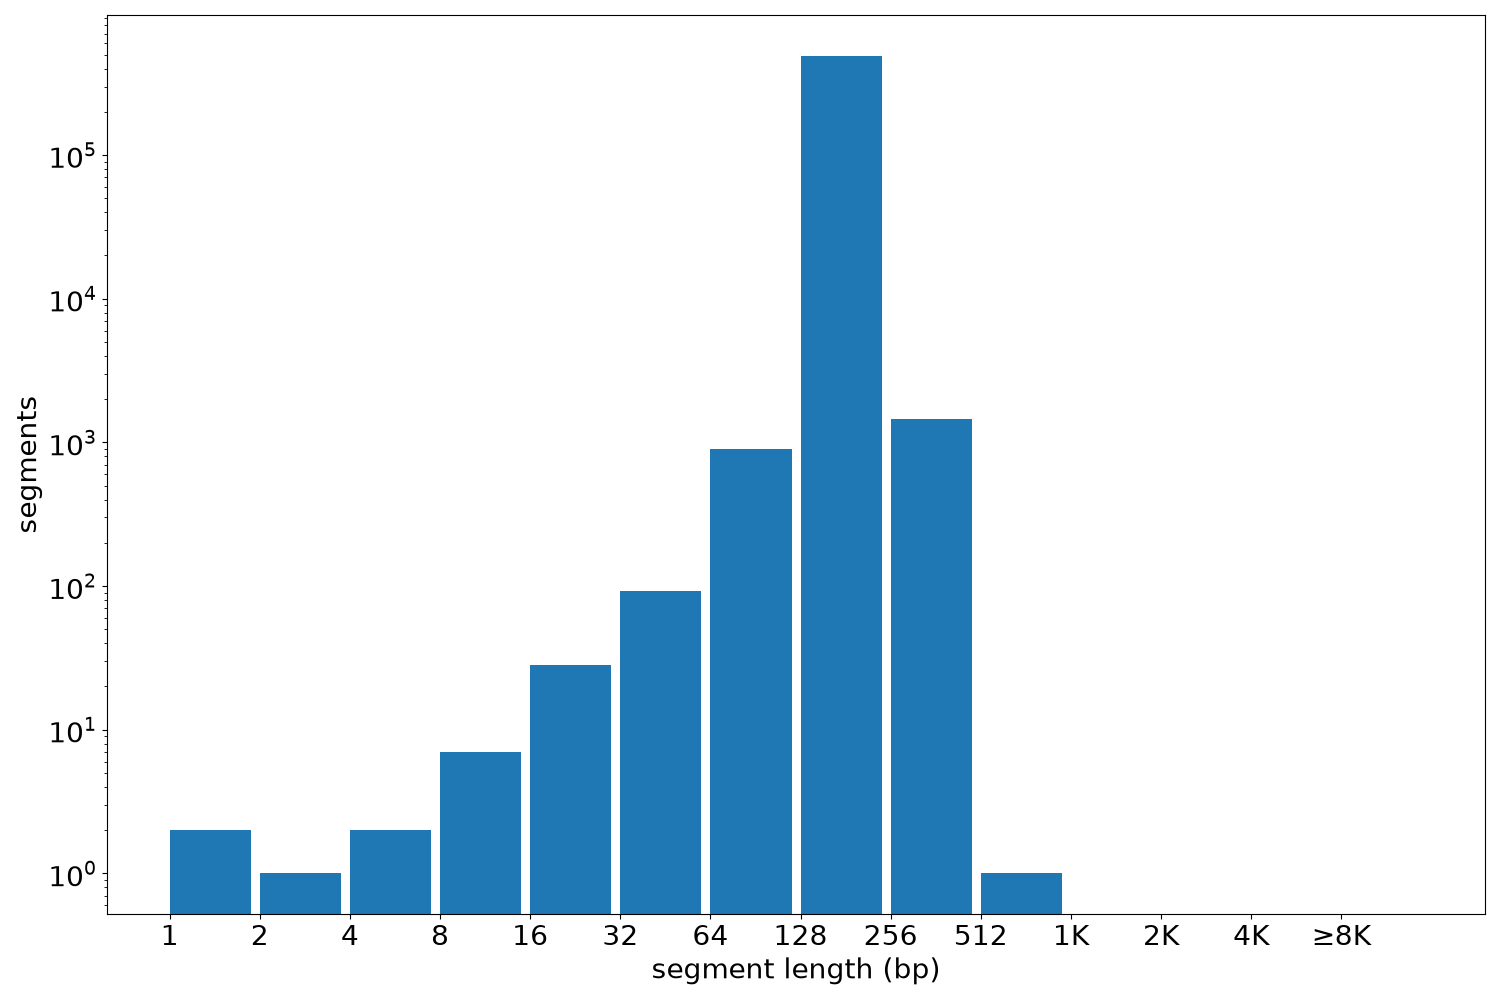
Segment lengths
| segments | min | max | mean | median | |
|---|---|---|---|---|---|
| segments | 492935 | 1 | 527 | 150.33 | 150 |
Files
| Filename | Size | md5 |
|---|---|---|
| ENCFF366HLY.bed.gz | 4.58 MB | 21f864e7716cd9a379e59b940f93eb2e |
| ENCFF366HLY.tabix.bed.gz | 3.93 MB | 84fa7e8959f86db5b35e7bff68215c26 |
| ENCFF366HLY.tabix.bed.gz.tbi | 798.19 KB | 15f010a7bdc26e155757b8e47c6c4deb |
| genomic_resource.yaml | 2.15 KB | 28b4286fd015cd8302196528a5ee21e9 |
| statistics/ |