Resource
| Id | DNase-seq/ENCSR223XND |
|---|---|
| Type | position_score |
| Version | 0 |
| Summary | DNase-seq ENCSR223XND [biosample_summary="Homo sapiens T-helper 2 cell male adult\ \ (35 years) treated with 5 \u03BCg/mL Interferon-gamma antibody for 36 hours,\ \ 100 ng/mL Interleukin-4 for 36 hours"] |
| Description |
status: released biological_replicates: Rep 1 summary: male adult (35 years) treated with 5 μg/mL Interferon-gamma antibody for 36 hours, 100 ng/mL Interleukin-4 for 36 hours output_type: peaks audit_warning: Signal Portion of Tags (SPOT) is a measure of enrichment, analogous to the commonly used fraction of reads in peaks metric. ENCODE processed alignment files {ENCFF966RTN|/files/ENCFF966RTN/} processed by DNase-seq ENCODE4 v3.0.0 GRCh38 pipeline ({ENCPL848KLD|/pipelines/ENCPL848KLD/}) for GRCh38 assembly have a SPOT1 score of 0.39. According to ENCODE standards, SPOT1 score of 0.4 or higher is considered a product of high quality data. Any sample with a SPOT1 score <0.3 should be targeted for replacement with a higher quality sample, and a SPOT1 score of 0.25 is considered minimally acceptable SPOT1 score of 0.25 is considered minimally acceptable for rare and hard to find primary tissues. (See {ENCODE DNase-seq data standards|/data-standards/dnase-seq-encode4/}) |
| Labels |
|
Scores (1)
| ID | Type | Default annotation | Description | Histogram | Range | Summary |
|---|---|---|---|---|---|---|
| DNase-seq_ENCSR223XND | float |
DNase-seq_ENCSR223XND |
DNase-seq ENCSR223XND [biosample_summary="Homo sapiens T-helper 2 cell male adult\ \ (35 years) treated with 5 \u03BCg/mL Interferon-gamma antibody for 36 hours,\ \ 100 ng/mL Interleukin-4 for 36 hours"]
|
 |
[0.0553, 23.4] |
|
n counts base pairs; sd is the population standard deviation.
Coverage
| Chromosome | Covered positions | Covered % | Segments |
|---|---|---|---|
| all chromosomes | 14476207 | 0.45% | 69473 |
| chr1 | 1452900 | 0.58% | 6908 |
| chr2 | 1067156 | 0.44% | 5216 |
| chr3 | 839724 | 0.42% | 4046 |
| chr4 | 500508 | 0.26% | 2461 |
| chr5 | 685345 | 0.38% | 3269 |
| chr6 | 874370 | 0.51% | 4182 |
| chr7 | 635115 | 0.40% | 3067 |
| chr8 | 578954 | 0.40% | 2787 |
| chr9 | 596118 | 0.43% | 2898 |
| chr10 | 694413 | 0.52% | 3316 |
| chr11 | 730806 | 0.54% | 3517 |
| chr12 | 726381 | 0.55% | 3478 |
| chr13 | 285433 | 0.25% | 1366 |
| chr14 | 487335 | 0.46% | 2353 |
| chr15 | 498058 | 0.49% | 2437 |
| chr16 | 573635 | 0.63% | 2710 |
| chr17 | 826211 | 0.99% | 3880 |
| chr18 | 241638 | 0.30% | 1180 |
| chr19 | 779585 | 1.33% | 3631 |
| chr20 | 408473 | 0.63% | 2000 |
| chr21 | 182352 | 0.39% | 879 |
| chr22 | 344065 | 0.68% | 1644 |
| chrX | 450445 | 0.29% | 2160 |
| chrY | 17187 | 0.03% | 88 |
| 3342 contigs with no values (129077085 bp) | 0 | 0.00% | 0 |
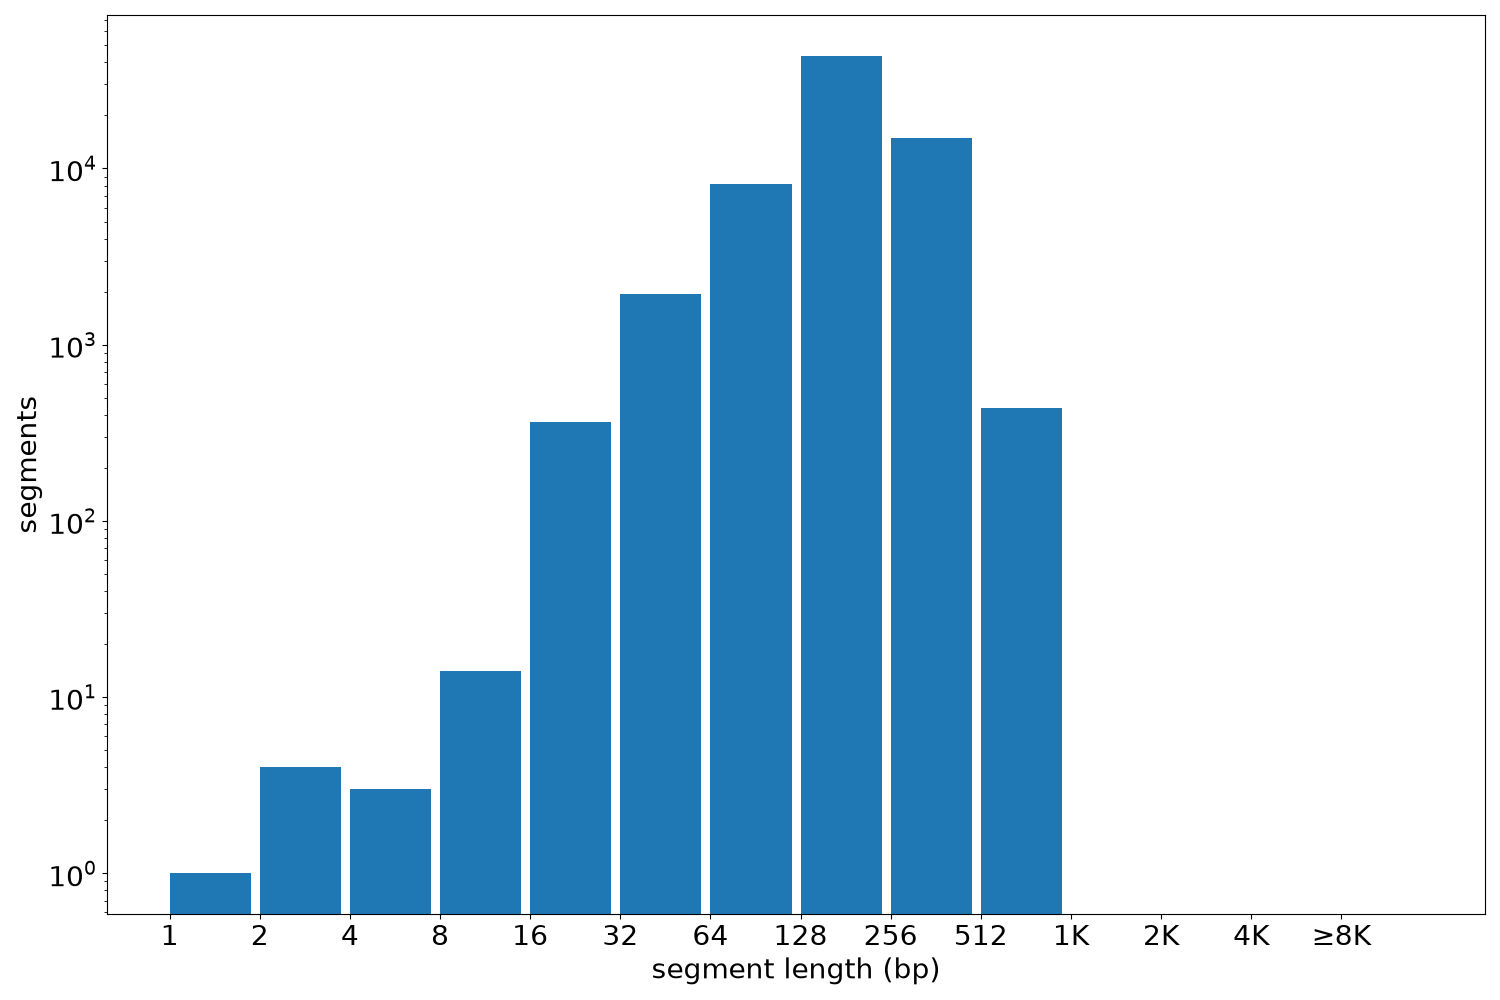
Segment lengths
| segments | min | max | mean | median | |
|---|---|---|---|---|---|
| segments | 69473 | 1 | 940 | 208.37 | 200 |
Files
| Filename | Size | md5 |
|---|---|---|
| ENCFF534UAS.bed.gz | 772.03 KB | 81ceab490f9e1fb3917e9dcf998d5e29 |
| ENCFF534UAS.tabix.bed.gz | 707.19 KB | 955e1628702020c7a4995ced34b44257 |
| ENCFF534UAS.tabix.bed.gz.tbi | 290.3 KB | 07324f798928c7745e873ea9fde3b721 |
| genomic_resource.yaml | 2.6 KB | 00b08d7b2a6a19f0c2885c12df09cbd7 |
| statistics/ |