Resource
| Id | DNase-seq/ENCSR217SET |
|---|---|
| Type | position_score |
| Version | 0 |
| Summary | DNase-seq ENCSR217SET [biosample_summary="Homo sapiens SW480"] |
| Description |
status: released biological_replicates: Rep 2 summary: output_type: peaks audit_internal_action: Archived analysis {ENCAN714NWB|/analyses/ENCAN714NWB/} has in progress subobject quality standard {encode3-dnase|/quality-standards/encode3-dnase/} audit_warning: Signal Portion of Tags (SPOT) is a measure of enrichment, analogous to the commonly used fraction of reads in peaks metric. ENCODE processed alignment files {ENCFF080TUY|/files/ENCFF080TUY/} processed by DNase-seq ENCODE3 GRCh38 pipeline ({ENCPL202DNS|/pipelines/ENCPL202DNS/}) for GRCh38 assembly have a SPOT1 score of 0.39. According to ENCODE standards, SPOT1 score of 0.4 or higher is considered a product of high quality data. Any sample with a SPOT1 score <0.3 should be targeted for replacement with a higher quality sample, and a SPOT1 score of 0.25 is considered minimally acceptable SPOT1 score of 0.25 is considered minimally acceptable for rare and hard to find primary tissues. (See {ENCODE DNase-seq data standards|/data-standards/dnase-seq/}) audit_warning: Signal Portion of Tags (SPOT) is a measure of enrichment, analogous to the commonly used fraction of reads in peaks metric. ENCODE processed alignment files {ENCFF242UZF|/files/ENCFF242UZF/} processed by DNase-seq ENCODE3 GRCh38 pipeline ({ENCPL202DNS|/pipelines/ENCPL202DNS/}) for GRCh38 assembly have a SPOT1 score of 0.32. According to ENCODE standards, SPOT1 score of 0.4 or higher is considered a product of high quality data. Any sample with a SPOT1 score <0.3 should be targeted for replacement with a higher quality sample, and a SPOT1 score of 0.25 is considered minimally acceptable SPOT1 score of 0.25 is considered minimally acceptable for rare and hard to find primary tissues. (See {ENCODE DNase-seq data standards|/data-standards/dnase-seq/}) |
| Labels |
|
Scores (1)
| ID | Type | Default annotation | Description | Histogram | Range | Summary |
|---|---|---|---|---|---|---|
| DNase-seq_ENCSR217SET | float |
DNase-seq_ENCSR217SET |
DNase-seq ENCSR217SET [biosample_summary="Homo sapiens SW480"]
|
 |
[3, 1.66e+05] |
|
n counts base pairs; sd is the population standard deviation.
Coverage
| Chromosome | Covered positions | Covered % | Segments |
|---|---|---|---|
| all chromosomes | 30803437 | 0.96% | 205210 |
| chr1 | 2734901 | 1.10% | 18217 |
| chr2 | 2528366 | 1.04% | 16840 |
| chr3 | 1962863 | 0.99% | 13076 |
| chr4 | 1313090 | 0.69% | 8747 |
| chr5 | 1787841 | 0.98% | 11912 |
| chr6 | 1666788 | 0.98% | 11100 |
| chr7 | 1754673 | 1.10% | 11694 |
| chr8 | 1374653 | 0.95% | 9159 |
| chr9 | 1274932 | 0.92% | 8495 |
| chr10 | 1424659 | 1.06% | 9494 |
| chr11 | 1631383 | 1.21% | 10869 |
| chr12 | 1542979 | 1.16% | 10282 |
| chr13 | 845392 | 0.74% | 5631 |
| chr14 | 986368 | 0.92% | 6571 |
| chr15 | 944093 | 0.93% | 6288 |
| chr16 | 1002000 | 1.11% | 6675 |
| chr17 | 1400915 | 1.68% | 9335 |
| chr18 | 624892 | 0.78% | 4159 |
| chr19 | 1053750 | 1.80% | 7019 |
| chr20 | 981877 | 1.52% | 6542 |
| chr21 | 407622 | 0.87% | 2715 |
| chr22 | 565650 | 1.11% | 3769 |
| chrX | 985950 | 0.63% | 6569 |
| chrY | 7800 | 0.01% | 52 |
| 3342 contigs with no values (129077085 bp) | 0 | 0.00% | 0 |
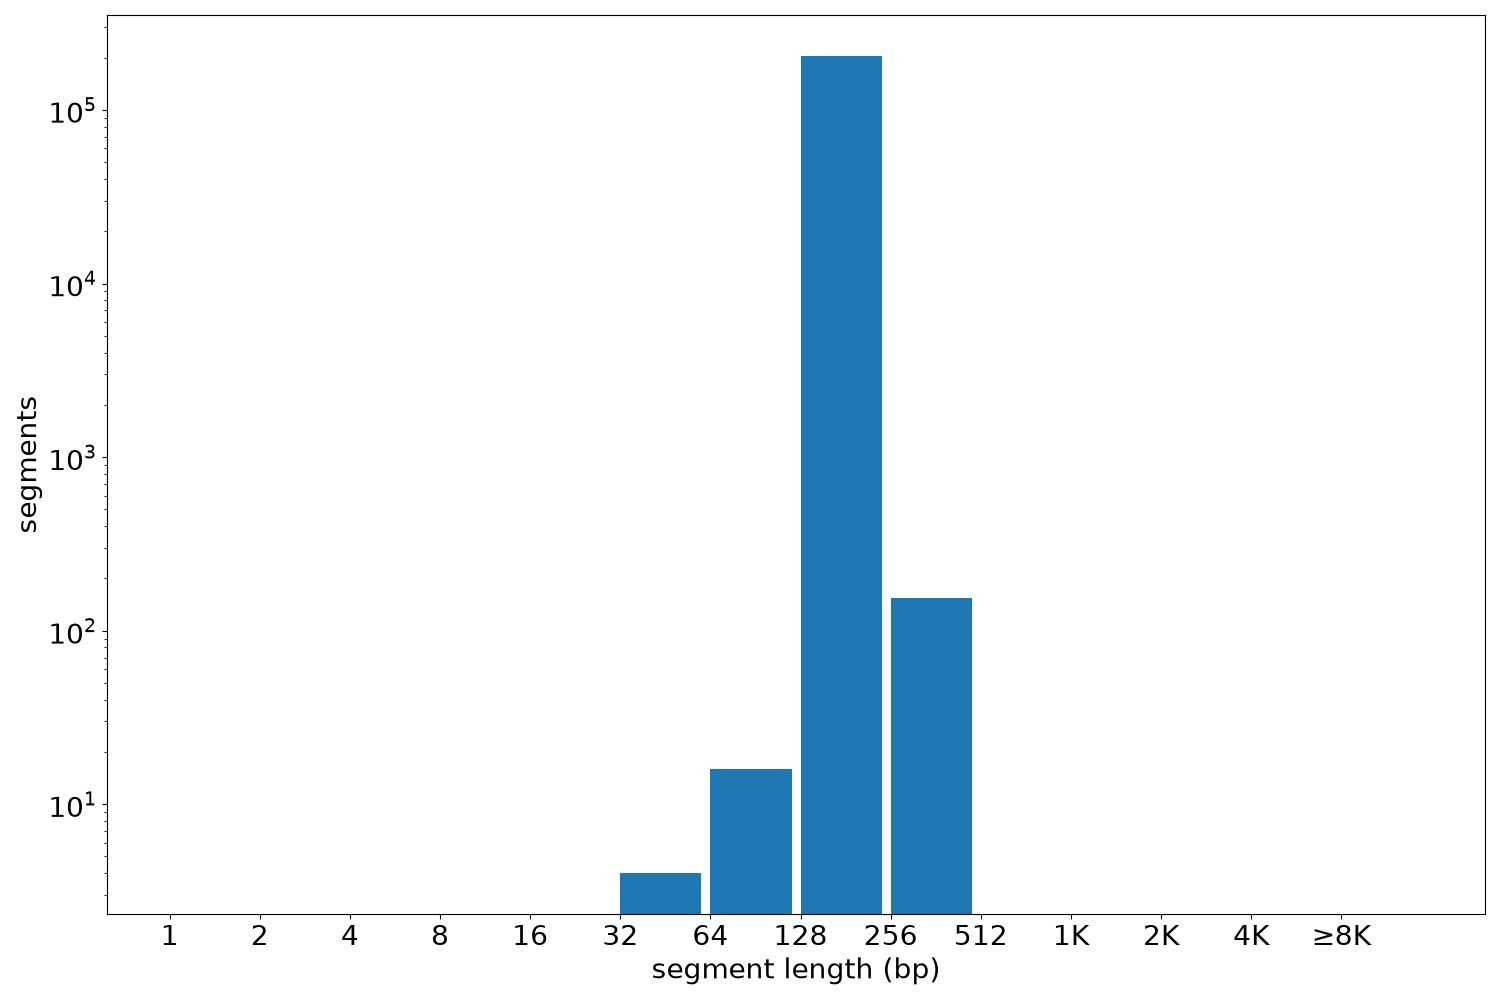
Segment lengths
| segments | min | max | mean | median | |
|---|---|---|---|---|---|
| segments | 205210 | 35 | 450 | 150.11 | 150 |
Files
| Filename | Size | md5 |
|---|---|---|
| ENCFF044QJS.bed.gz | 1.95 MB | 5774fbccfc22f4ac8170be00d9b573e1 |
| ENCFF044QJS.tabix.bed.gz | 1.69 MB | 87dd1461f53ce471e2c2386673e883ae |
| ENCFF044QJS.tabix.bed.gz.tbi | 665.11 KB | ae87bf669ebf357a235c9658c15f55d9 |
| genomic_resource.yaml | 2.91 KB | 83a9bb99391529caa0c73f1ab23bc87a |
| statistics/ |