Resource
| Id | DNase-seq/ENCSR197BFD |
|---|---|
| Type | position_score |
| Version | 0 |
| Summary | DNase-seq ENCSR197BFD [biosample_summary="Homo sapiens mesenteric fat pad tissue female adult (59 years)"] |
| Description |
status: released biological_replicates: Rep 1 summary: female adult (59 years) output_type: peaks audit_warning: Signal Portion of Tags (SPOT) is a measure of enrichment, analogous to the commonly used fraction of reads in peaks metric. ENCODE processed alignment files {ENCFF446CLG|/files/ENCFF446CLG/} processed by DNase-seq ENCODE4 v3.0.0-alpha.2 GRCh38 pipeline ({ENCPL848KLD|/pipelines/ENCPL848KLD/}) for GRCh38 assembly have a SPOT1 score of 0.27. According to ENCODE standards, SPOT1 score of 0.4 or higher is considered a product of high quality data. Any sample with a SPOT1 score <0.3 should be targeted for replacement with a higher quality sample, and a SPOT1 score of 0.25 is considered minimally acceptable SPOT1 score of 0.25 is considered minimally acceptable for rare and hard to find primary tissues. (See {ENCODE DNase-seq data standards|/data-standards/dnase-seq-encode4/}) |
| Labels |
|
Scores (1)
| ID | Type | Default annotation | Description | Histogram | Range | Summary |
|---|---|---|---|---|---|---|
| DNase-seq_ENCSR197BFD | float |
DNase-seq_ENCSR197BFD |
DNase-seq ENCSR197BFD [biosample_summary="Homo sapiens mesenteric fat pad tissue female adult (59 years)"]
|
 |
[0.0429, 6.35] |
|
n counts base pairs; sd is the population standard deviation.
Coverage
| Chromosome | Covered positions | Covered % | Segments |
|---|---|---|---|
| all chromosomes | 42848644 | 1.33% | 197716 |
| chr1 | 3780290 | 1.52% | 17063 |
| chr2 | 3991089 | 1.65% | 18228 |
| chr3 | 1871944 | 0.94% | 8758 |
| chr4 | 1033551 | 0.54% | 4779 |
| chr5 | 1921376 | 1.06% | 8835 |
| chr6 | 1555384 | 0.91% | 7251 |
| chr7 | 2468579 | 1.55% | 11308 |
| chr8 | 1714184 | 1.18% | 7849 |
| chr9 | 1897631 | 1.37% | 8775 |
| chr10 | 2731899 | 2.04% | 12543 |
| chr11 | 2355911 | 1.74% | 10736 |
| chr12 | 1870203 | 1.40% | 8755 |
| chr13 | 718956 | 0.63% | 3377 |
| chr14 | 1593126 | 1.49% | 7279 |
| chr15 | 1679734 | 1.65% | 7968 |
| chr16 | 1758023 | 1.95% | 8314 |
| chr17 | 2491006 | 2.99% | 11617 |
| chr18 | 788180 | 0.98% | 3626 |
| chr19 | 1542713 | 2.63% | 7265 |
| chr20 | 1485040 | 2.30% | 6828 |
| chr21 | 833800 | 1.79% | 3719 |
| chr22 | 1694287 | 3.33% | 7635 |
| chrX | 1069992 | 0.69% | 5194 |
| chrY | 1746 | <0.01% | 14 |
| 3342 contigs with no values (129077085 bp) | 0 | 0.00% | 0 |
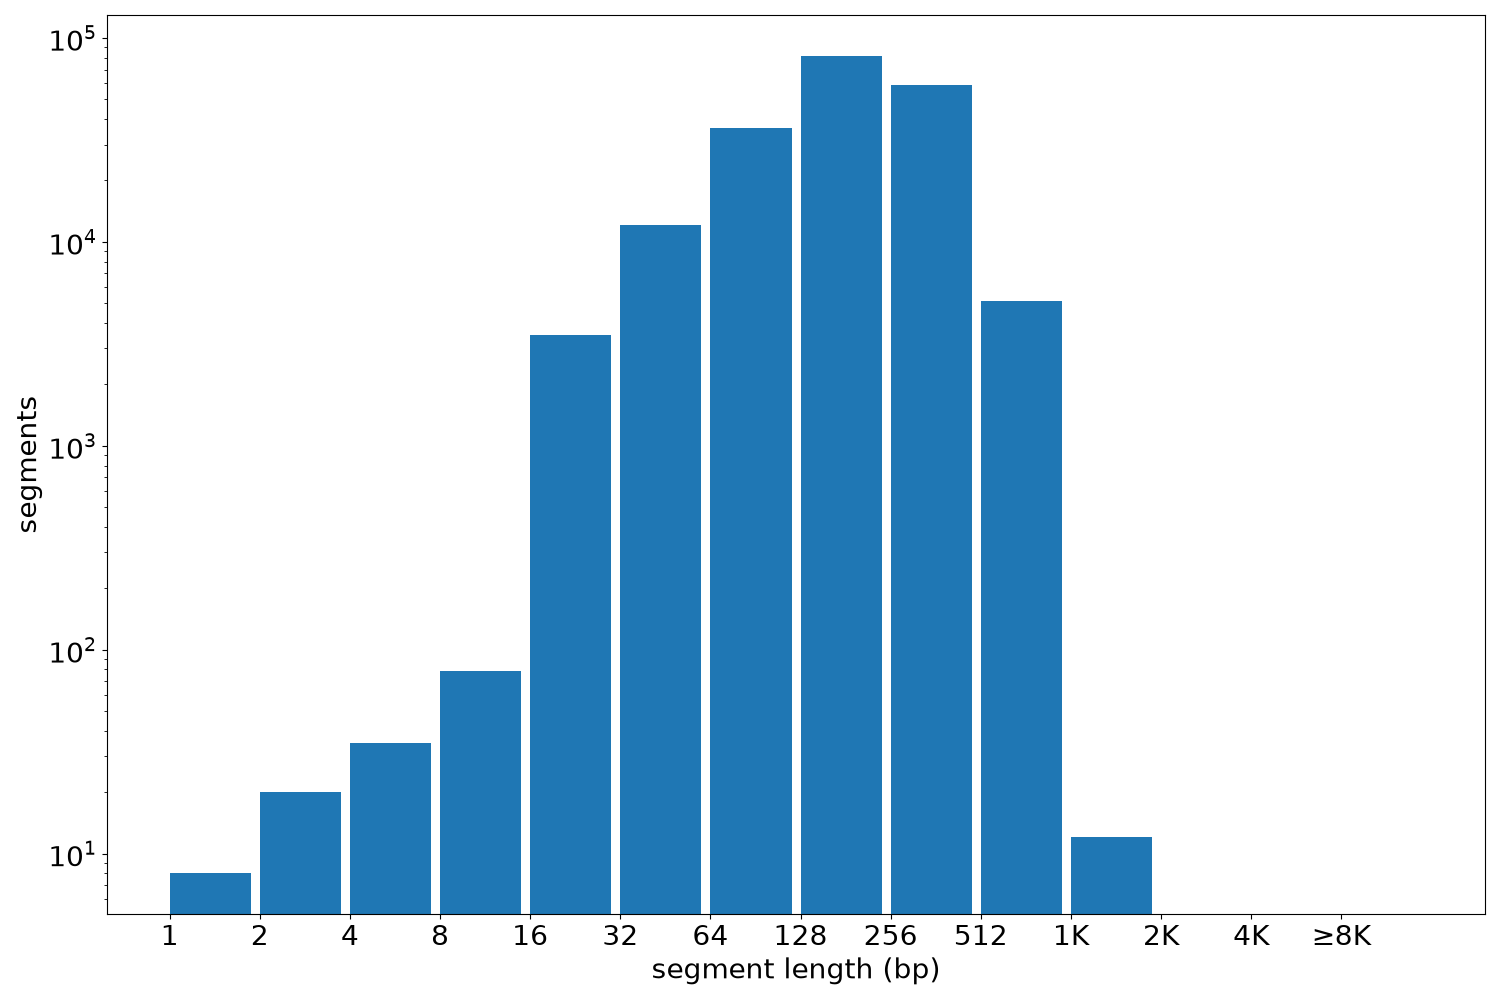
Segment lengths
| segments | min | max | mean | median | |
|---|---|---|---|---|---|
| segments | 197716 | 1 | 1360 | 216.72 | 200 |
Files
| Filename | Size | md5 |
|---|---|---|
| ENCFF925JXF.bed.gz | 1.78 MB | 9a58b3c21ea62769cf58c88de93ff28b |
| ENCFF925JXF.tabix.bed.gz | 1.71 MB | f2b9bec1e9d126437e6a2229994ed9fa |
| ENCFF925JXF.tabix.bed.gz.tbi | 217.1 KB | 89c0d47170ca4a1cb94c38c5de500e35 |
| genomic_resource.yaml | 2.06 KB | 0301e715f8e3371519fa48320384d6d6 |
| statistics/ |