Resource
| Id | DNase-seq/ENCSR195ONB |
|---|---|
| Type | position_score |
| Version | 0 |
| Summary | DNase-seq ENCSR195ONB [biosample_summary="Homo sapiens thyroid gland tissue female adult (53 years)"] |
| Description |
status: released biological_replicates: Rep 1 summary: female adult (53 years) output_type: peaks audit_internal_action: Archived analysis {ENCAN785BGD|/analyses/ENCAN785BGD/} has in progress subobject quality standard {encode3-dnase|/quality-standards/encode3-dnase/} audit_warning: Signal Portion of Tags (SPOT) is a measure of enrichment, analogous to the commonly used fraction of reads in peaks metric. ENCODE processed alignment files {ENCFF697BUT|/files/ENCFF697BUT/} processed by DNase-seq ENCODE3 GRCh38 pipeline ({ENCPL202DNS|/pipelines/ENCPL202DNS/}) for GRCh38 assembly have a SPOT1 score of 0.38. According to ENCODE standards, SPOT1 score of 0.4 or higher is considered a product of high quality data. Any sample with a SPOT1 score <0.3 should be targeted for replacement with a higher quality sample, and a SPOT1 score of 0.25 is considered minimally acceptable SPOT1 score of 0.25 is considered minimally acceptable for rare and hard to find primary tissues. (See {ENCODE DNase-seq data standards|/data-standards/dnase-seq/}) |
| Labels |
|
Scores (1)
| ID | Type | Default annotation | Description | Histogram | Range | Summary |
|---|---|---|---|---|---|---|
| DNase-seq_ENCSR195ONB | float |
DNase-seq_ENCSR195ONB |
DNase-seq ENCSR195ONB [biosample_summary="Homo sapiens thyroid gland tissue female adult (53 years)"]
|
 |
[7, 6.59e+03] |
|
n counts base pairs; sd is the population standard deviation.
Coverage
| Chromosome | Covered positions | Covered % | Segments |
|---|---|---|---|
| all chromosomes | 9645506 | 0.30% | 64226 |
| chr1 | 943552 | 0.38% | 6286 |
| chr2 | 737580 | 0.30% | 4907 |
| chr3 | 608636 | 0.31% | 4056 |
| chr4 | 426146 | 0.22% | 2839 |
| chr5 | 482267 | 0.27% | 3208 |
| chr6 | 563376 | 0.33% | 3755 |
| chr7 | 447060 | 0.28% | 2976 |
| chr8 | 402975 | 0.28% | 2680 |
| chr9 | 442244 | 0.32% | 2945 |
| chr10 | 463697 | 0.35% | 3085 |
| chr11 | 517965 | 0.38% | 3447 |
| chr12 | 472343 | 0.35% | 3143 |
| chr13 | 223008 | 0.19% | 1489 |
| chr14 | 325499 | 0.30% | 2169 |
| chr15 | 333066 | 0.33% | 2217 |
| chr16 | 366878 | 0.41% | 2444 |
| chr17 | 467132 | 0.56% | 3112 |
| chr18 | 197987 | 0.25% | 1319 |
| chr19 | 396411 | 0.68% | 2640 |
| chr20 | 270872 | 0.42% | 1802 |
| chr21 | 106139 | 0.23% | 708 |
| chr22 | 209935 | 0.41% | 1397 |
| chrX | 239388 | 0.15% | 1593 |
| chrY | 1350 | <0.01% | 9 |
| 3342 contigs with no values (129077085 bp) | 0 | 0.00% | 0 |
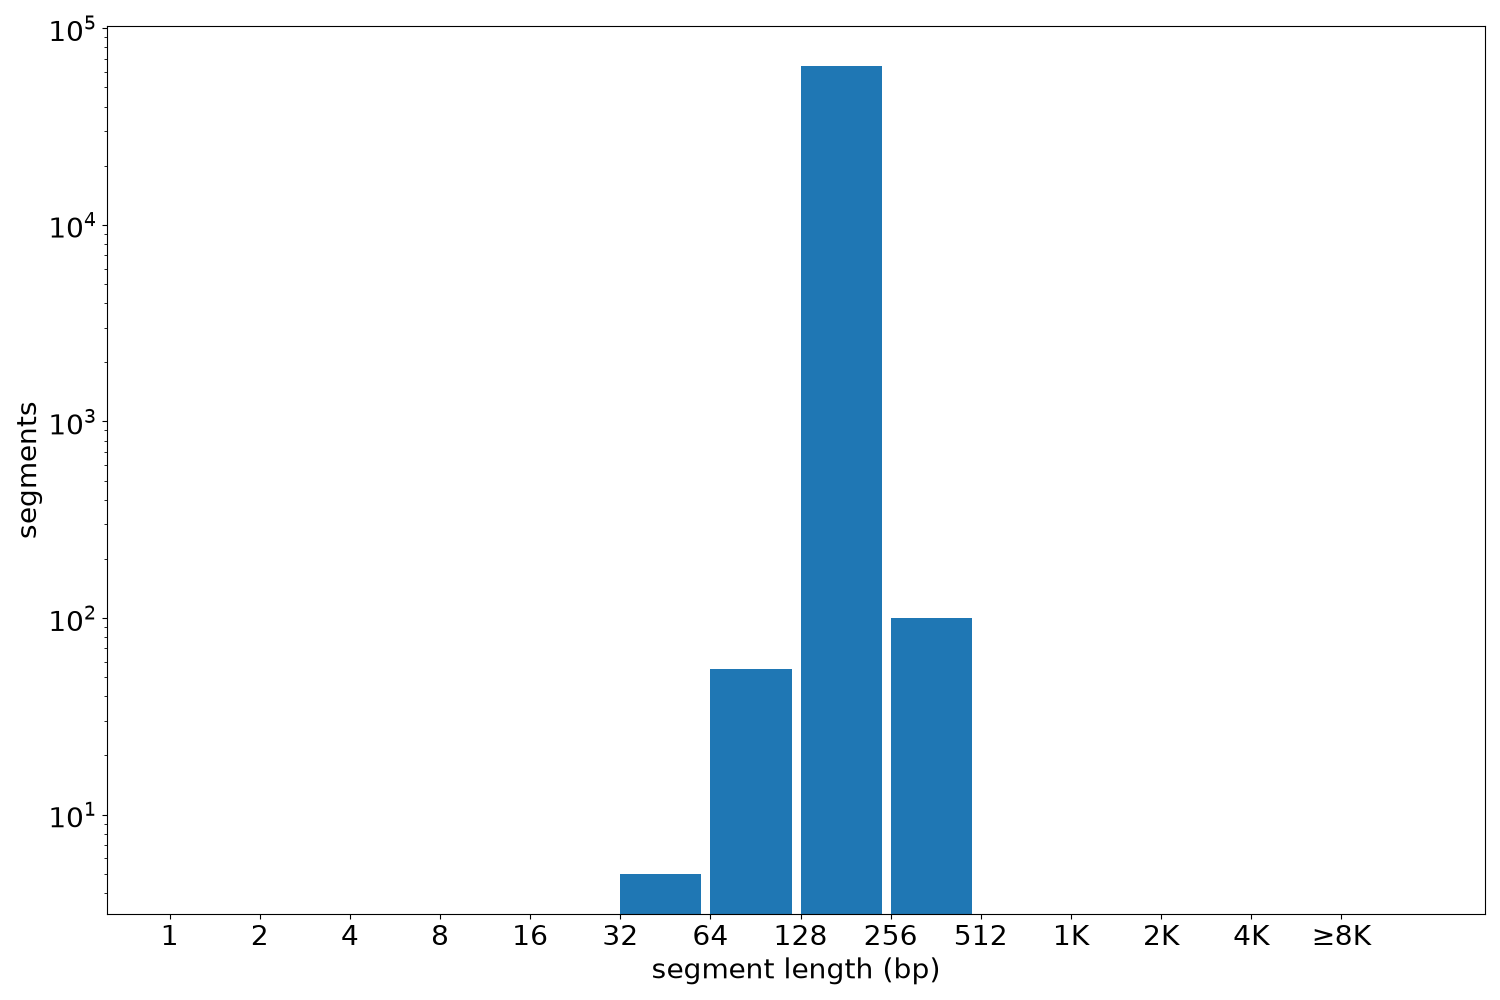
Segment lengths
| segments | min | max | mean | median | |
|---|---|---|---|---|---|
| segments | 64226 | 34 | 449 | 150.18 | 150 |
Files
| Filename | Size | md5 |
|---|---|---|
| ENCFF491CZT.bed.gz | 644.58 KB | b52d340a64de6f1860e61388ff57e614 |
| ENCFF491CZT.tabix.bed.gz | 550.44 KB | 58f1e23320755d94a868e22007dd203b |
| ENCFF491CZT.tabix.bed.gz.tbi | 309.5 KB | dc1fad944d4d4b6eb86f808c63aee60d |
| genomic_resource.yaml | 2.21 KB | a008f4b74d68a7beb272c1e713a3f4a9 |
| statistics/ |