Resource
| Id | DNase-seq/ENCSR175IWT |
|---|---|
| Type | position_score |
| Version | 0 |
| Summary | DNase-seq ENCSR175IWT [biosample_summary="Homo sapiens kidney tubule cell female adult (80 years) and male adult (62 years)"] |
| Description |
status: released biological_replicates: Rep 1 summary: female adult (80 years) male adult (62 years) output_type: peaks audit_warning: Signal Portion of Tags (SPOT) is a measure of enrichment, analogous to the commonly used fraction of reads in peaks metric. ENCODE processed alignment files {ENCFF977YJN|/files/ENCFF977YJN/} processed by DNase-seq ENCODE4 v3.0.0-alpha.2 GRCh38 pipeline ({ENCPL848KLD|/pipelines/ENCPL848KLD/}) for GRCh38 assembly have a SPOT1 score of 0.38. According to ENCODE standards, SPOT1 score of 0.4 or higher is considered a product of high quality data. Any sample with a SPOT1 score <0.3 should be targeted for replacement with a higher quality sample, and a SPOT1 score of 0.25 is considered minimally acceptable SPOT1 score of 0.25 is considered minimally acceptable for rare and hard to find primary tissues. (See {ENCODE DNase-seq data standards|/data-standards/dnase-seq-encode4/}) |
| Labels |
|
Scores (1)
| ID | Type | Default annotation | Description | Histogram | Range | Summary |
|---|---|---|---|---|---|---|
| DNase-seq_ENCSR175IWT | float |
DNase-seq_ENCSR175IWT |
DNase-seq ENCSR175IWT [biosample_summary="Homo sapiens kidney tubule cell female adult (80 years) and male adult (62 years)"]
|
 |
[0.0129, 15.7] |
|
n counts base pairs; sd is the population standard deviation.
Coverage
| Chromosome | Covered positions | Covered % | Segments |
|---|---|---|---|
| all chromosomes | 57810502 | 1.80% | 276293 |
| chr1 | 5288872 | 2.12% | 25225 |
| chr2 | 4845166 | 2.00% | 23229 |
| chr3 | 3982186 | 2.01% | 18996 |
| chr4 | 3165527 | 1.66% | 15285 |
| chr5 | 3305548 | 1.82% | 15826 |
| chr6 | 3589248 | 2.10% | 17048 |
| chr7 | 2973031 | 1.87% | 14262 |
| chr8 | 2785363 | 1.92% | 13367 |
| chr9 | 2519222 | 1.82% | 12042 |
| chr10 | 2792774 | 2.09% | 13344 |
| chr11 | 2835253 | 2.10% | 13573 |
| chr12 | 2822186 | 2.12% | 13427 |
| chr13 | 1661994 | 1.45% | 8013 |
| chr14 | 1815310 | 1.70% | 8683 |
| chr15 | 1882074 | 1.85% | 8852 |
| chr16 | 1649802 | 1.83% | 7905 |
| chr17 | 2198963 | 2.64% | 10350 |
| chr18 | 1402684 | 1.75% | 6756 |
| chr19 | 1535198 | 2.62% | 7231 |
| chr20 | 1444093 | 2.24% | 6877 |
| chr21 | 675305 | 1.45% | 3210 |
| chr22 | 930552 | 1.83% | 4497 |
| chrX | 1707705 | 1.09% | 8279 |
| chrY | 2446 | <0.01% | 16 |
| 3342 contigs with no values (129077085 bp) | 0 | 0.00% | 0 |
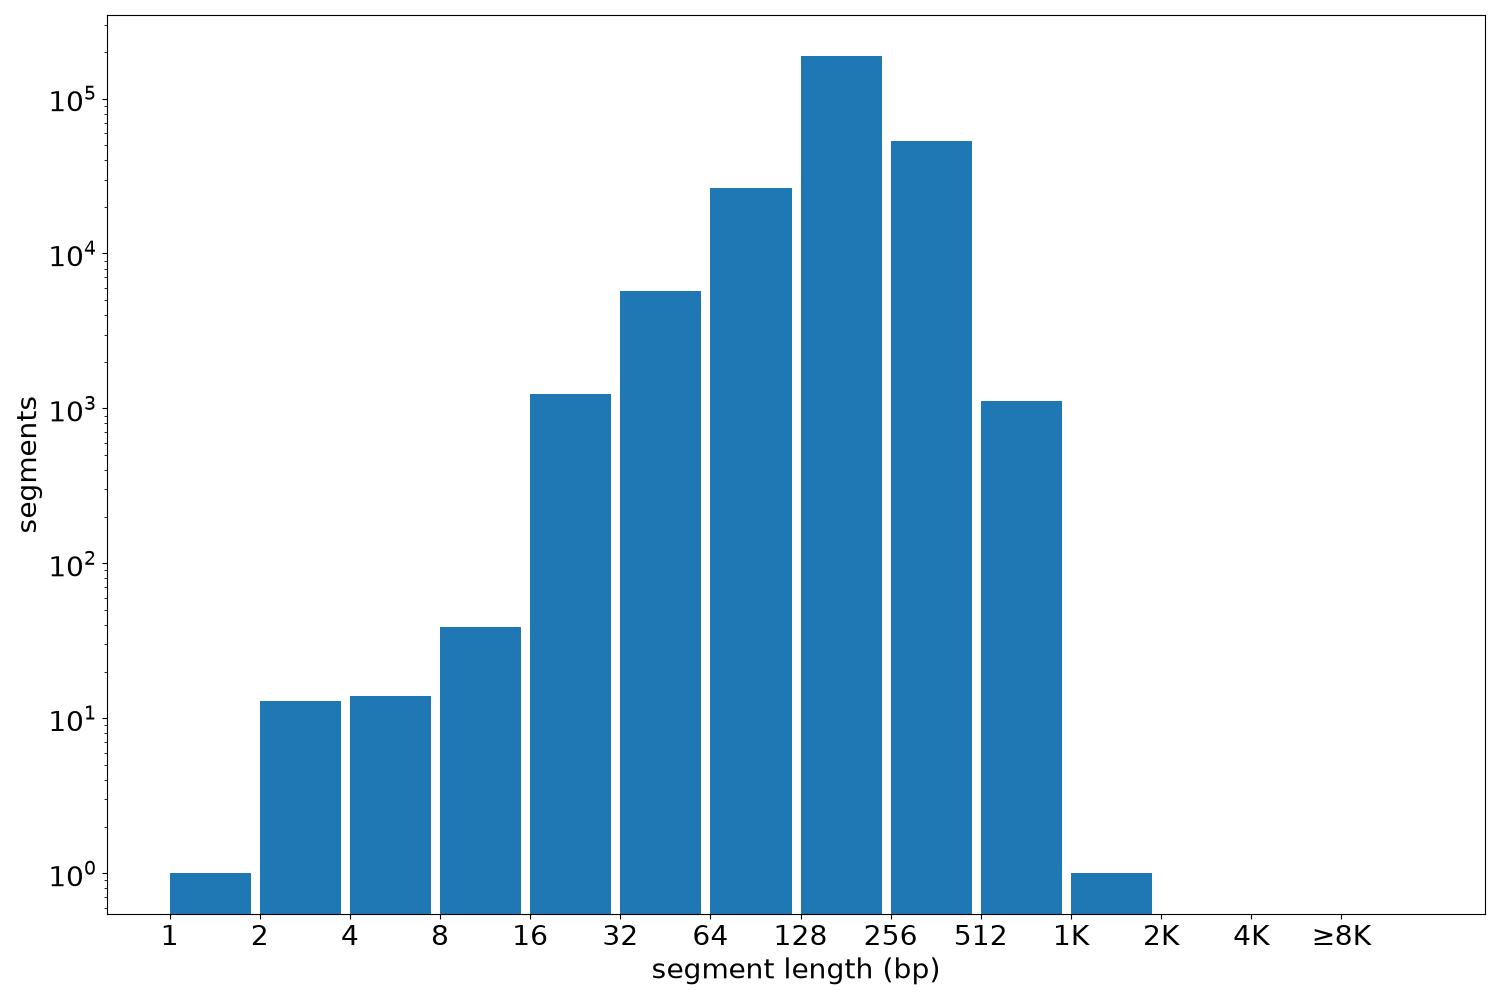
Segment lengths
| segments | min | max | mean | median | |
|---|---|---|---|---|---|
| segments | 276293 | 1 | 1080 | 209.24 | 200 |
Files
| Filename | Size | md5 |
|---|---|---|
| ENCFF416ORJ.bed.gz | 2.98 MB | 226a6b0b85934ade251ff7e988c4a1dd |
| ENCFF416ORJ.tabix.bed.gz | 2.73 MB | 765985cab9580b82cec1e6c68d2eb119 |
| ENCFF416ORJ.tabix.bed.gz.tbi | 734.22 KB | ba88b62546124ae9a82ba3dfd4b6c40e |
| genomic_resource.yaml | 2.17 KB | 8883e8980926efbd2d3118c0670e89c3 |
| statistics/ |