Resource
| Id | DNase-seq/ENCSR160VHJ |
|---|---|
| Type | position_score |
| Version | 0 |
| Summary | DNase-seq ENCSR160VHJ [biosample_summary="Homo sapiens central memory CD8-positive, alpha-beta T cell male adult (36 years)"] |
| Description |
status: released biological_replicates: Rep 1 summary: male adult (36 years) output_type: peaks audit_warning: Signal Portion of Tags (SPOT) is a measure of enrichment, analogous to the commonly used fraction of reads in peaks metric. ENCODE processed alignment files {ENCFF500RTP|/files/ENCFF500RTP/} processed by DNase-seq ENCODE4 v3.0.0 GRCh38 pipeline ({ENCPL848KLD|/pipelines/ENCPL848KLD/}) for GRCh38 assembly have a SPOT1 score of 0.32. According to ENCODE standards, SPOT1 score of 0.4 or higher is considered a product of high quality data. Any sample with a SPOT1 score <0.3 should be targeted for replacement with a higher quality sample, and a SPOT1 score of 0.25 is considered minimally acceptable SPOT1 score of 0.25 is considered minimally acceptable for rare and hard to find primary tissues. (See {ENCODE DNase-seq data standards|/data-standards/dnase-seq-encode4/}) |
| Labels |
|
Scores (1)
| ID | Type | Default annotation | Description | Histogram | Range | Summary |
|---|---|---|---|---|---|---|
| DNase-seq_ENCSR160VHJ | float |
DNase-seq_ENCSR160VHJ |
DNase-seq ENCSR160VHJ [biosample_summary="Homo sapiens central memory CD8-positive, alpha-beta T cell male adult (36 years)"]
|
 |
[0.0652, 34.2] |
|
n counts base pairs; sd is the population standard deviation.
Coverage
| Chromosome | Covered positions | Covered % | Segments |
|---|---|---|---|
| all chromosomes | 9365914 | 0.29% | 45038 |
| chr1 | 918132 | 0.37% | 4383 |
| chr2 | 670859 | 0.28% | 3239 |
| chr3 | 507423 | 0.26% | 2438 |
| chr4 | 295255 | 0.16% | 1374 |
| chr5 | 429976 | 0.24% | 2077 |
| chr6 | 553721 | 0.32% | 2640 |
| chr7 | 420208 | 0.26% | 2066 |
| chr8 | 351274 | 0.24% | 1707 |
| chr9 | 355166 | 0.26% | 1716 |
| chr10 | 464032 | 0.35% | 2233 |
| chr11 | 484729 | 0.36% | 2340 |
| chr12 | 465343 | 0.35% | 2220 |
| chr13 | 176475 | 0.15% | 823 |
| chr14 | 325517 | 0.30% | 1564 |
| chr15 | 315010 | 0.31% | 1564 |
| chr16 | 387901 | 0.43% | 1878 |
| chr17 | 561473 | 0.67% | 2691 |
| chr18 | 137233 | 0.17% | 666 |
| chr19 | 600278 | 1.02% | 2800 |
| chr20 | 251818 | 0.39% | 1238 |
| chr21 | 104390 | 0.22% | 519 |
| chr22 | 255569 | 0.50% | 1262 |
| chrX | 312967 | 0.20% | 1499 |
| chrY | 21165 | 0.04% | 101 |
| 3342 contigs with no values (129077085 bp) | 0 | 0.00% | 0 |
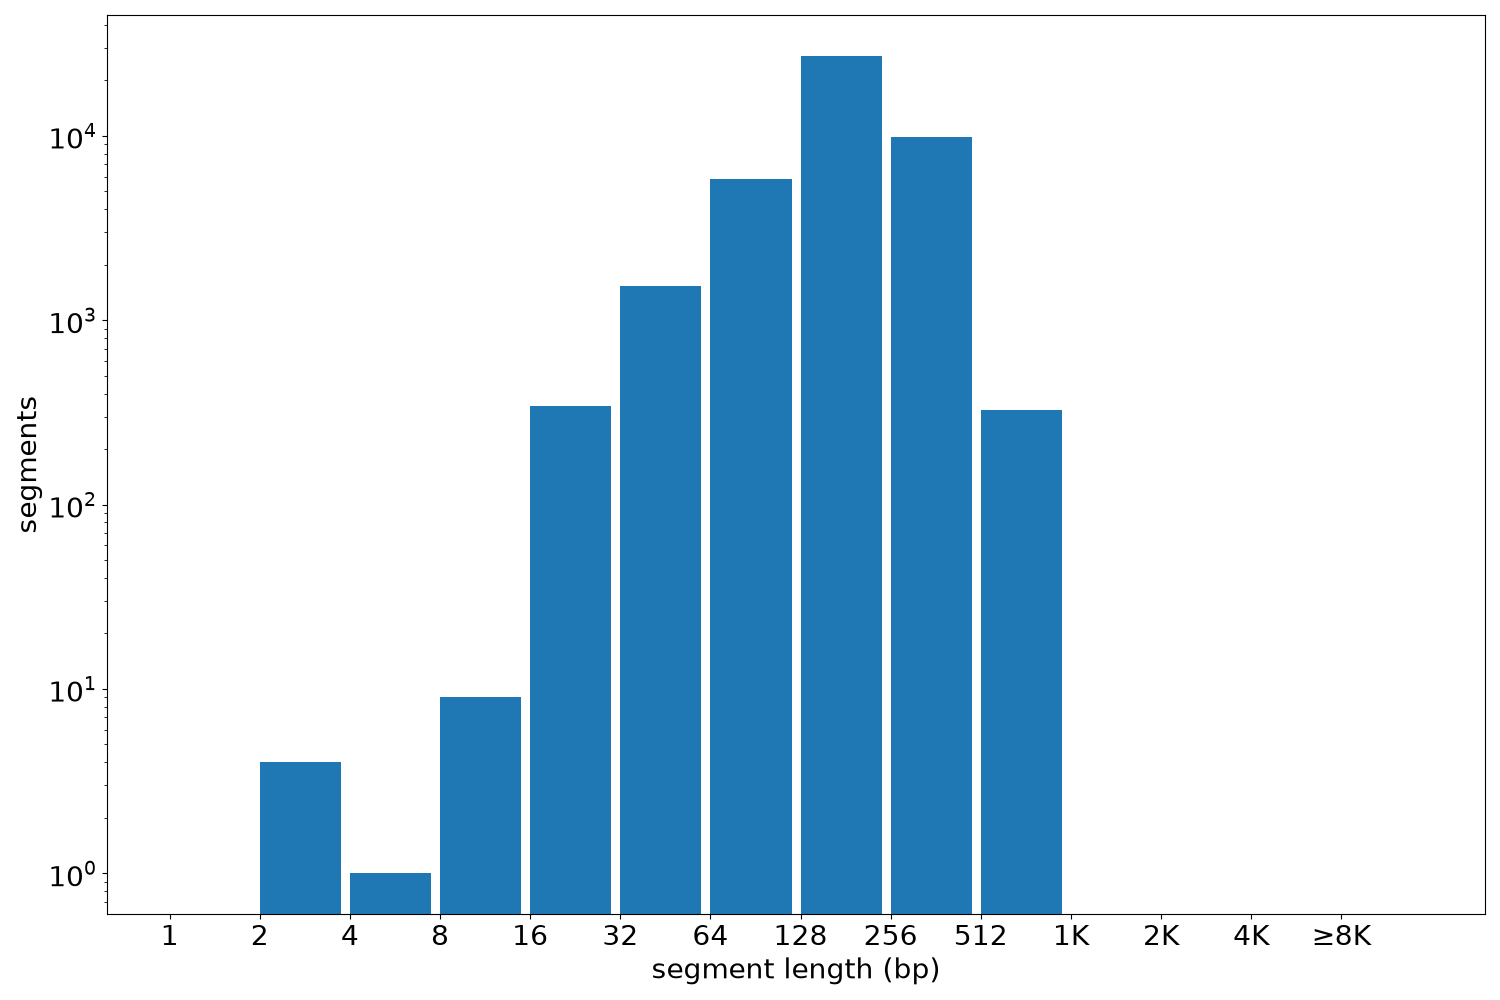
Segment lengths
| segments | min | max | mean | median | |
|---|---|---|---|---|---|
| segments | 45038 | 2 | 900 | 207.96 | 200 |
Files
| Filename | Size | md5 |
|---|---|---|
| ENCFF449AXZ.bed.gz | 501.79 KB | 47567feaae201833332536b5eb3c2c79 |
| ENCFF449AXZ.tabix.bed.gz | 461.11 KB | 136e970af255fd96330b435d1e17ad59 |
| ENCFF449AXZ.tabix.bed.gz.tbi | 208.12 KB | 092d7cb0f4f0a47d3f6f3709fe7637ee |
| genomic_resource.yaml | 2.11 KB | 1ba83603e8202138df0b923f79460921 |
| statistics/ |