Resource
| Id | DNase-seq/ENCSR098PTC |
|---|---|
| Type | position_score |
| Version | 0 |
| Summary | DNase-seq ENCSR098PTC [biosample_summary="Homo sapiens hematopoietic multipotent progenitor cell"] |
| Description |
status: released biological_replicates: Rep 1 summary: male adult (25 years) output_type: peaks audit_internal_action: Archived analysis {ENCAN822CJB|/analyses/ENCAN822CJB/} has in progress subobject quality standard {encode3-dnase|/quality-standards/encode3-dnase/} audit_not_compliant: Replicate concordance in DNase-seq experiments is measured by calculating the Pearson correlation between signal quantification of the replicates. ENCODE processed signal files {ENCFF996GHG|/files/ENCFF996GHG/}, {ENCFF438PGV|/files/ENCFF438PGV/} processed by DNase-seq ENCODE3 GRCh38 pipeline ({ENCPL001DNS|/pipelines/ENCPL001DNS/}) for GRCh38 assembly have a Pearson correlation of 0.80. According to ENCODE standards, in an isogenic assay a Pearson correlation value > 0.9 is recommended. (See {ENCODE DNase-seq data standards|/data-standards/dnase-seq/} ) |
| Labels |
|
Scores (1)
| ID | Type | Default annotation | Description | Histogram | Range | Summary |
|---|---|---|---|---|---|---|
| DNase-seq_ENCSR098PTC | float |
DNase-seq_ENCSR098PTC |
DNase-seq ENCSR098PTC [biosample_summary="Homo sapiens hematopoietic multipotent progenitor cell"]
|
 |
[6, 1.53e+04] |
|
n counts base pairs; sd is the population standard deviation.
Coverage
| Chromosome | Covered positions | Covered % | Segments |
|---|---|---|---|
| all chromosomes | 33733582 | 1.05% | 224638 |
| chr1 | 3109630 | 1.25% | 20701 |
| chr2 | 2716961 | 1.12% | 18099 |
| chr3 | 2230458 | 1.12% | 14855 |
| chr4 | 1720283 | 0.90% | 11446 |
| chr5 | 1789473 | 0.99% | 11919 |
| chr6 | 2022396 | 1.18% | 13466 |
| chr7 | 1787271 | 1.12% | 11905 |
| chr8 | 1521250 | 1.05% | 10129 |
| chr9 | 1366737 | 0.99% | 9108 |
| chr10 | 1605729 | 1.20% | 10688 |
| chr11 | 1601801 | 1.19% | 10662 |
| chr12 | 1632259 | 1.22% | 10871 |
| chr13 | 950445 | 0.83% | 6333 |
| chr14 | 1085665 | 1.01% | 7227 |
| chr15 | 1083676 | 1.06% | 7213 |
| chr16 | 1035444 | 1.15% | 6893 |
| chr17 | 1443298 | 1.73% | 9614 |
| chr18 | 742374 | 0.92% | 4940 |
| chr19 | 1206072 | 2.06% | 8039 |
| chr20 | 865967 | 1.34% | 5767 |
| chr21 | 417537 | 0.89% | 2781 |
| chr22 | 631025 | 1.24% | 4205 |
| chrX | 1092478 | 0.70% | 7274 |
| chrY | 75353 | 0.13% | 503 |
| 3342 contigs with no values (129077085 bp) | 0 | 0.00% | 0 |
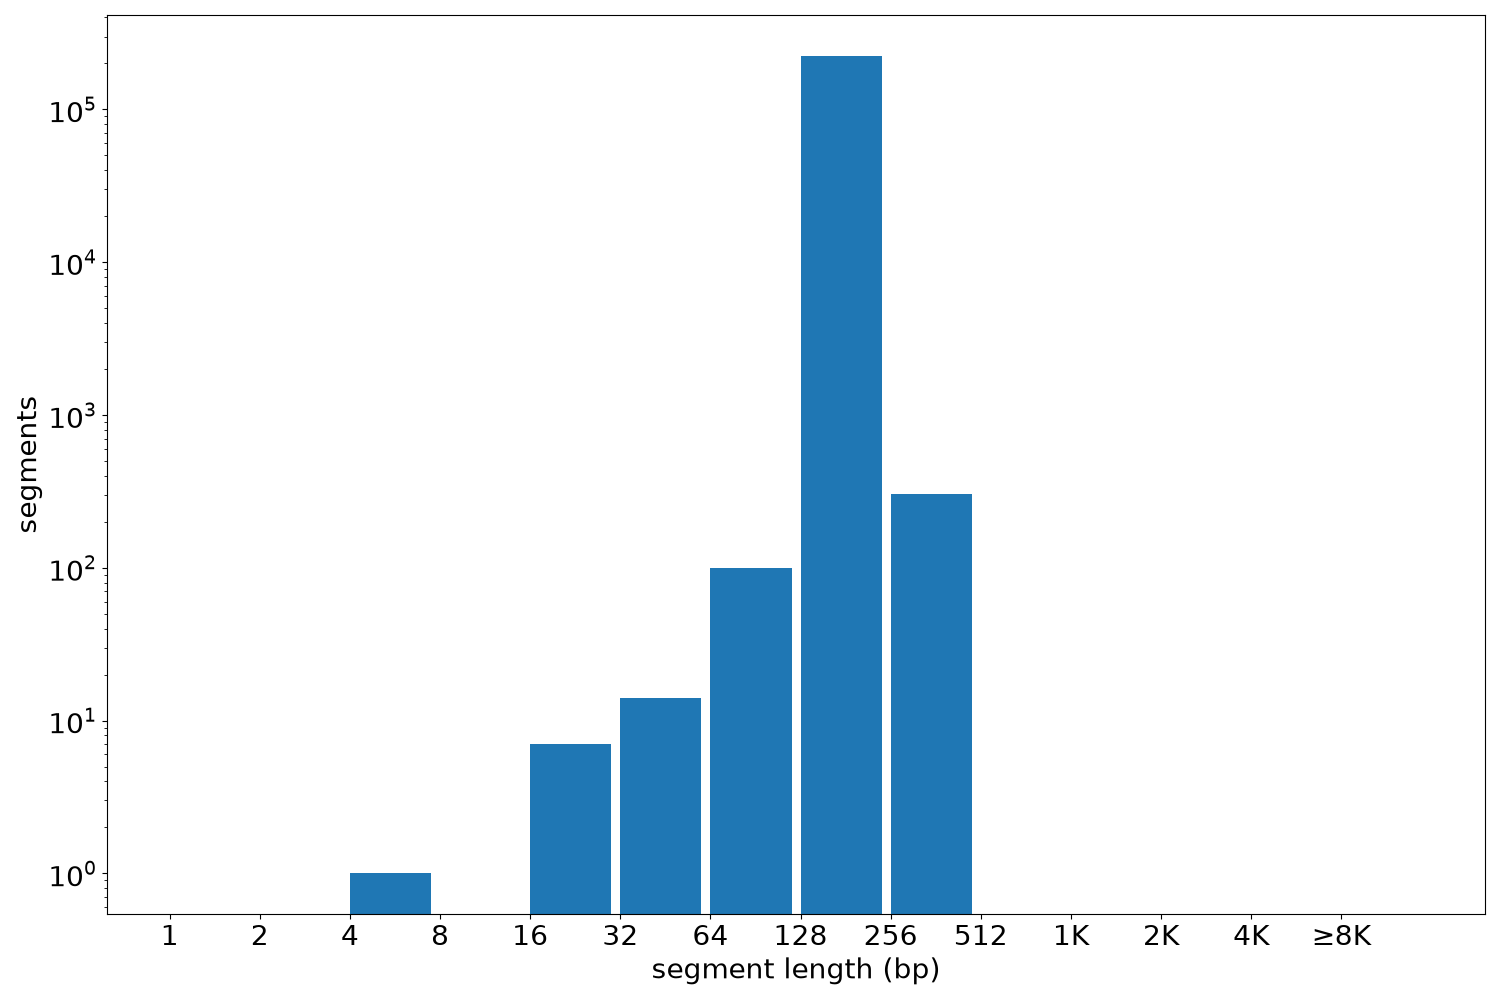
Segment lengths
| segments | min | max | mean | median | |
|---|---|---|---|---|---|
| segments | 224638 | 6 | 450 | 150.17 | 150 |
Files
| Filename | Size | md5 |
|---|---|---|
| ENCFF273EMN.bed.gz | 2.16 MB | 9716f32802d780524e56b6590a6350d6 |
| ENCFF273EMN.tabix.bed.gz | 1.87 MB | ae91d1bbbf1b161f2e1f04bb274929ec |
| ENCFF273EMN.tabix.bed.gz.tbi | 669.63 KB | def8262161c92eba672ffe519e18d772 |
| genomic_resource.yaml | 2.01 KB | d5e3d26f1f3a32bf426d1c2b828eef53 |
| statistics/ |