Resource
| Id | DNase-seq/ENCSR059LXL |
|---|---|
| Type | position_score |
| Version | 0 |
| Summary | DNase-seq ENCSR059LXL [biosample_summary="Homo sapiens muscle of leg tissue male embryo (96 days)"] |
| Description |
status: released biological_replicates: Rep 1 summary: male embryo (96 days) output_type: peaks audit_warning: Alignment file {ENCFF503BFE|/files/ENCFF503BFE/} processed by DNase-seq ENCODE4 v3.0.0-alpha.2 GRCh38 pipeline ( {ENCPL848KLD|/pipelines/ENCPL848KLD/} ) for GRCh38 assembly has 37121775 mapped reads. According to ENCODE standards, conventional DNase-seq profile requires a minimum of 20 million uniquely mapped reads to generate a reliable SPOT (Signal Portion of Tags) score. The recommended value is > 50 million. For deep, foot-printing depth DNase-seq 150-200 million uniquely mapped reads are recommended. (See {ENCODE DNase-seq data standards|/data-standards/dnase-seq-encode4/}) audit_warning: Signal Portion of Tags (SPOT) is a measure of enrichment, analogous to the commonly used fraction of reads in peaks metric. ENCODE processed alignment files {ENCFF503BFE|/files/ENCFF503BFE/} processed by DNase-seq ENCODE4 v3.0.0-alpha.2 GRCh38 pipeline ({ENCPL848KLD|/pipelines/ENCPL848KLD/}) for GRCh38 assembly have a SPOT1 score of 0.33. According to ENCODE standards, SPOT1 score of 0.4 or higher is considered a product of high quality data. Any sample with a SPOT1 score <0.3 should be targeted for replacement with a higher quality sample, and a SPOT1 score of 0.25 is considered minimally acceptable SPOT1 score of 0.25 is considered minimally acceptable for rare and hard to find primary tissues. (See {ENCODE DNase-seq data standards|/data-standards/dnase-seq-encode4/}) |
| Labels |
|
Scores (1)
| ID | Type | Default annotation | Description | Histogram | Range | Summary |
|---|---|---|---|---|---|---|
| DNase-seq_ENCSR059LXL | float |
DNase-seq_ENCSR059LXL |
DNase-seq ENCSR059LXL [biosample_summary="Homo sapiens muscle of leg tissue male embryo (96 days)"]
|
 |
[0.216, 10.6] |
|
n counts base pairs; sd is the population standard deviation.
Coverage
| Chromosome | Covered positions | Covered % | Segments |
|---|---|---|---|
| all chromosomes | 9206571 | 0.29% | 43714 |
| chr1 | 830449 | 0.33% | 3877 |
| chr2 | 756215 | 0.31% | 3574 |
| chr3 | 617194 | 0.31% | 2934 |
| chr4 | 467299 | 0.25% | 2210 |
| chr5 | 539203 | 0.30% | 2600 |
| chr6 | 584426 | 0.34% | 2722 |
| chr7 | 434681 | 0.27% | 2124 |
| chr8 | 423319 | 0.29% | 2024 |
| chr9 | 406541 | 0.29% | 1948 |
| chr10 | 419108 | 0.31% | 2061 |
| chr11 | 485137 | 0.36% | 2291 |
| chr12 | 480680 | 0.36% | 2221 |
| chr13 | 254644 | 0.22% | 1206 |
| chr14 | 319359 | 0.30% | 1454 |
| chr15 | 305879 | 0.30% | 1442 |
| chr16 | 262453 | 0.29% | 1302 |
| chr17 | 359790 | 0.43% | 1715 |
| chr18 | 201331 | 0.25% | 988 |
| chr19 | 385830 | 0.66% | 1719 |
| chr20 | 213756 | 0.33% | 1036 |
| chr21 | 103411 | 0.22% | 508 |
| chr22 | 135743 | 0.27% | 657 |
| chrX | 210158 | 0.13% | 1057 |
| chrY | 9965 | 0.02% | 44 |
| 3342 contigs with no values (129077085 bp) | 0 | 0.00% | 0 |
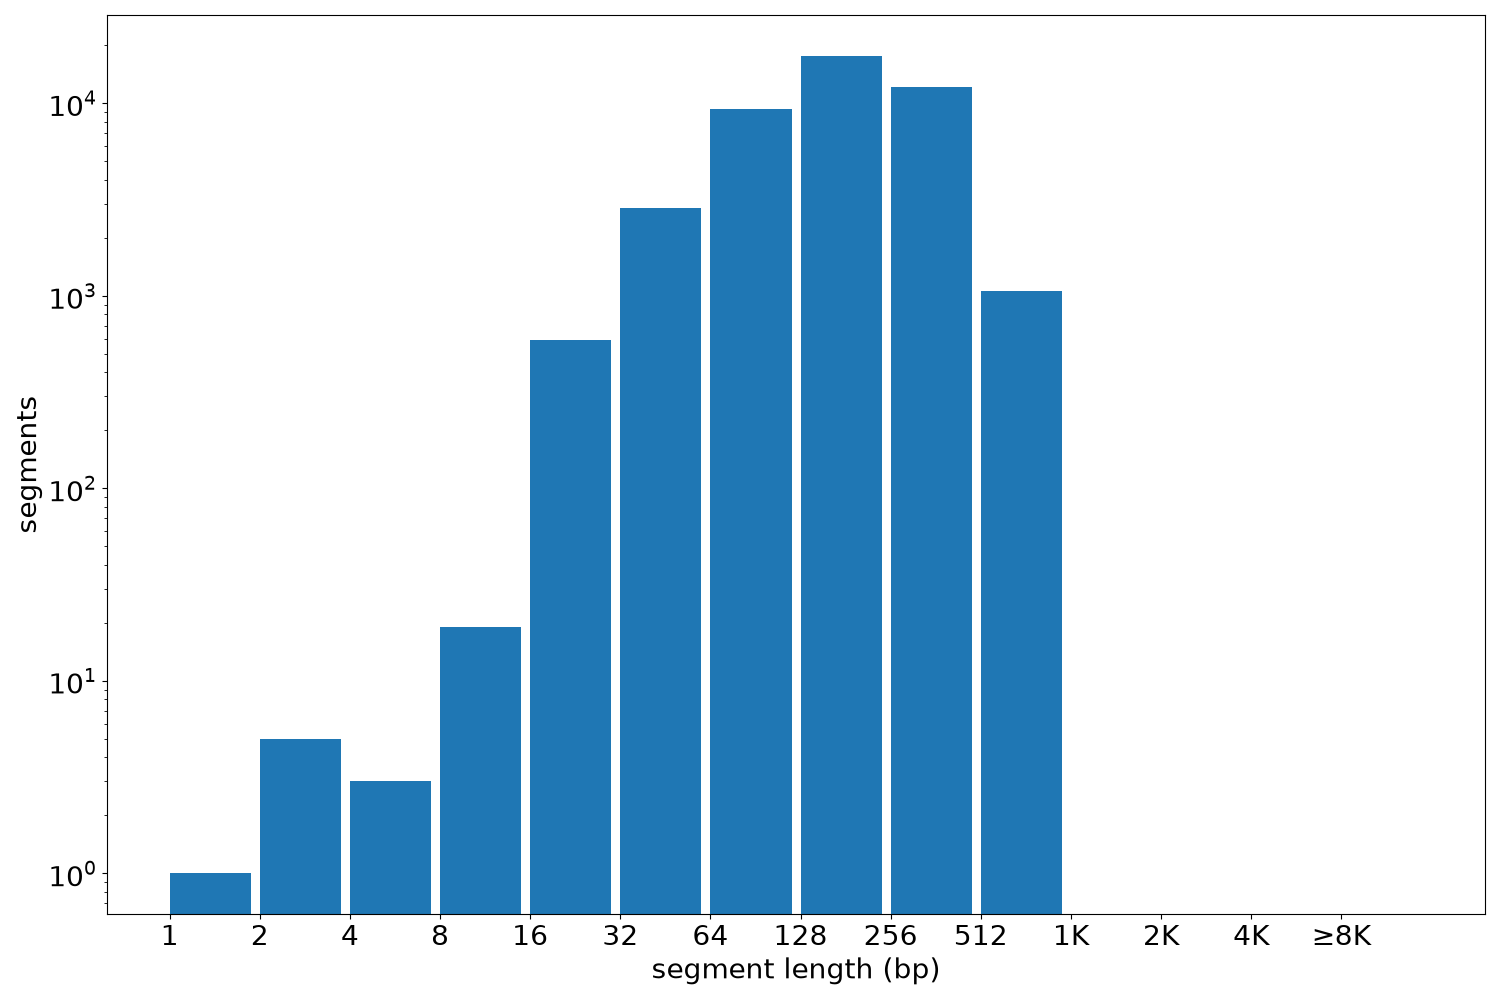
Segment lengths
| segments | min | max | mean | median | |
|---|---|---|---|---|---|
| segments | 43714 | 1 | 960 | 210.61 | 194 |
Files
| Filename | Size | md5 |
|---|---|---|
| ENCFF141TDT.bed.gz | 440.76 KB | 837ca1c8b3b4a784fa3461792155c9a9 |
| ENCFF141TDT.tabix.bed.gz | 404.15 KB | 4f7e60fd7f1eceaf3cbfb04eaf9aef15 |
| ENCFF141TDT.tabix.bed.gz.tbi | 226.62 KB | 18909f79e658909df2272476b5caaacd |
| genomic_resource.yaml | 2.66 KB | 6b54f90aea7378cbc85c85780d8cddd9 |
| statistics/ |