Resource
| Id | DNase-seq/ENCSR017OZH |
|---|---|
| Type | position_score |
| Version | 0 |
| Summary | DNase-seq ENCSR017OZH [biosample_summary="Homo sapiens H9 S1 phase stably expressing CDT1, stably expressing GMNN"] |
| Description |
status: released biological_replicates: Rep 1 summary: stably expressing C-terminal DsRed-tagged CDT1, stably expressing N-terminal eGFP-tagged GMNN S1 phase output_type: peaks audit_internal_action: Archived analysis {ENCAN529HKZ|/analyses/ENCAN529HKZ/} has in progress subobject quality standard {encode3-dnase|/quality-standards/encode3-dnase/} audit_warning: Signal Portion of Tags (SPOT) is a measure of enrichment, analogous to the commonly used fraction of reads in peaks metric. ENCODE processed alignment files {ENCFF997FAV|/files/ENCFF997FAV/} processed by DNase-seq ENCODE3 GRCh38 pipeline ({ENCPL202DNS|/pipelines/ENCPL202DNS/}) for GRCh38 assembly have a SPOT1 score of 0.32. According to ENCODE standards, SPOT1 score of 0.4 or higher is considered a product of high quality data. Any sample with a SPOT1 score <0.3 should be targeted for replacement with a higher quality sample, and a SPOT1 score of 0.25 is considered minimally acceptable SPOT1 score of 0.25 is considered minimally acceptable for rare and hard to find primary tissues. (See {ENCODE DNase-seq data standards|/data-standards/dnase-seq/}) audit_warning: Signal Portion of Tags (SPOT) is a measure of enrichment, analogous to the commonly used fraction of reads in peaks metric. ENCODE processed alignment files {ENCFF967UAJ|/files/ENCFF967UAJ/} processed by DNase-seq ENCODE3 GRCh38 pipeline ({ENCPL202DNS|/pipelines/ENCPL202DNS/}) for GRCh38 assembly have a SPOT1 score of 0.30. According to ENCODE standards, SPOT1 score of 0.4 or higher is considered a product of high quality data. Any sample with a SPOT1 score <0.3 should be targeted for replacement with a higher quality sample, and a SPOT1 score of 0.25 is considered minimally acceptable SPOT1 score of 0.25 is considered minimally acceptable for rare and hard to find primary tissues. (See {ENCODE DNase-seq data standards|/data-standards/dnase-seq/}) |
| Labels |
|
Scores (1)
| ID | Type | Default annotation | Description | Histogram | Range | Summary |
|---|---|---|---|---|---|---|
| DNase-seq_ENCSR017OZH | float |
DNase-seq_ENCSR017OZH |
DNase-seq ENCSR017OZH [biosample_summary="Homo sapiens H9 S1 phase stably expressing CDT1, stably expressing GMNN"]
|
 |
[1, 3.55e+04] |
|
n counts base pairs; sd is the population standard deviation.
Coverage
| Chromosome | Covered positions | Covered % | Segments |
|---|---|---|---|
| all chromosomes | 31407308 | 0.98% | 208821 |
| chr1 | 2788473 | 1.12% | 18555 |
| chr2 | 2482464 | 1.02% | 16507 |
| chr3 | 1989678 | 1.00% | 13237 |
| chr4 | 1709074 | 0.90% | 11349 |
| chr5 | 1818996 | 1.00% | 12092 |
| chr6 | 1890745 | 1.11% | 12566 |
| chr7 | 1682852 | 1.06% | 11193 |
| chr8 | 1446003 | 1.00% | 9611 |
| chr9 | 1298354 | 0.94% | 8632 |
| chr10 | 1490076 | 1.11% | 9904 |
| chr11 | 1559427 | 1.15% | 10370 |
| chr12 | 1522604 | 1.14% | 10122 |
| chr13 | 894398 | 0.78% | 5942 |
| chr14 | 1016854 | 0.95% | 6768 |
| chr15 | 956471 | 0.94% | 6363 |
| chr16 | 1009308 | 1.12% | 6713 |
| chr17 | 1238467 | 1.49% | 8234 |
| chr18 | 641499 | 0.80% | 4266 |
| chr19 | 1063486 | 1.81% | 7080 |
| chr20 | 804109 | 1.25% | 5340 |
| chr21 | 337699 | 0.72% | 2245 |
| chr22 | 517335 | 1.02% | 3446 |
| chrX | 1240236 | 0.79% | 8228 |
| chrY | 8700 | 0.02% | 58 |
| 3342 contigs with no values (129077085 bp) | 0 | 0.00% | 0 |
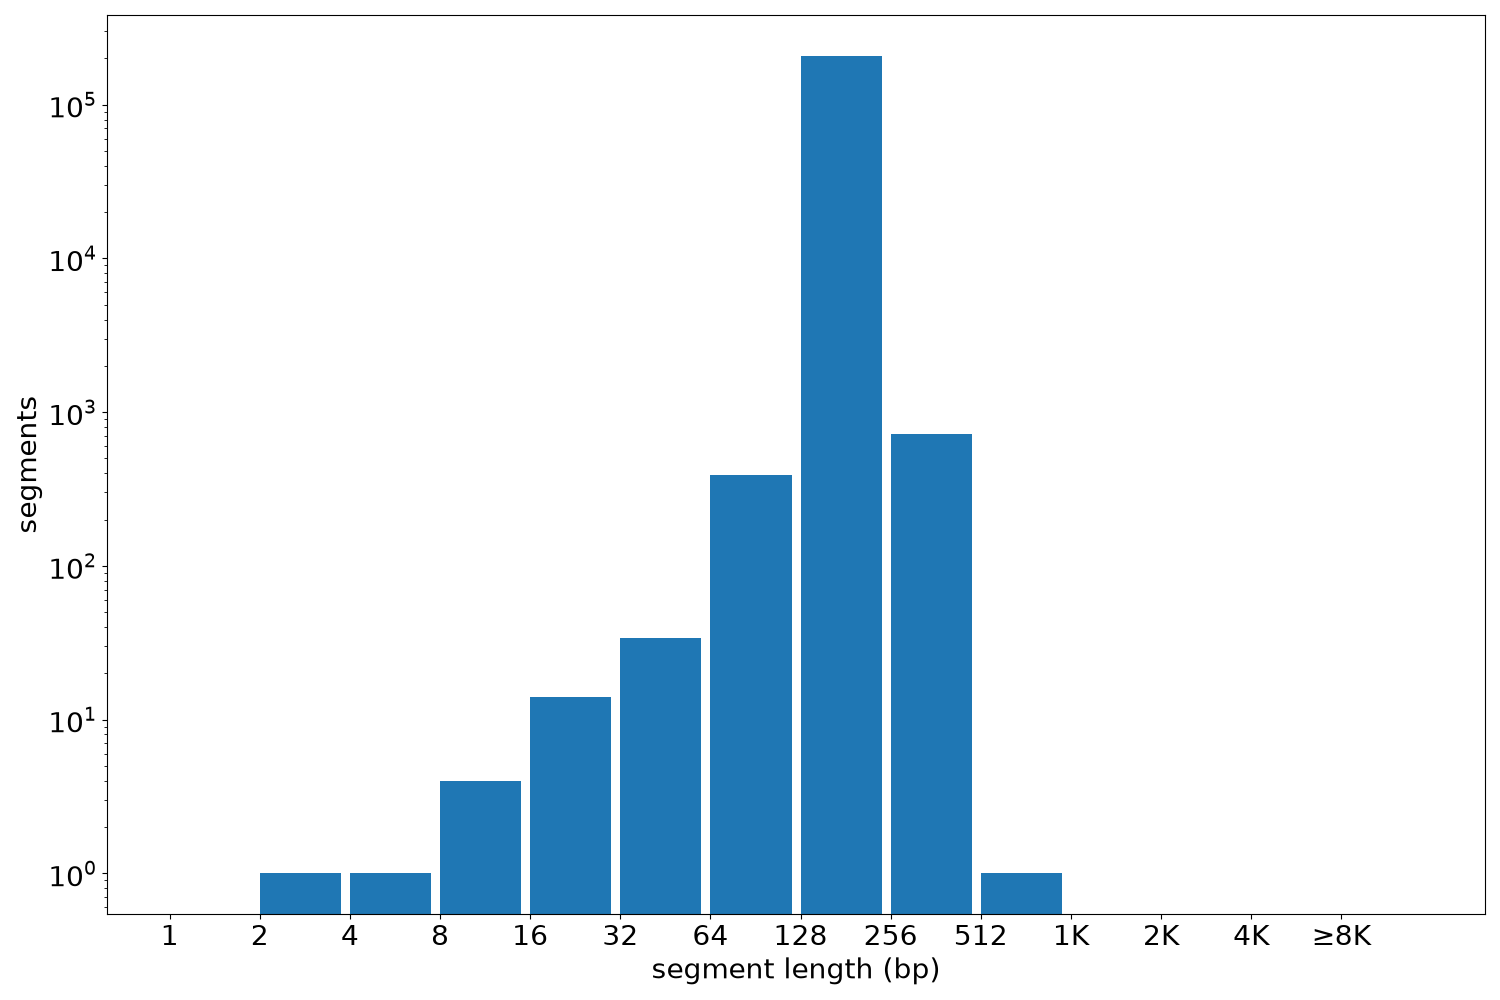
Segment lengths
| segments | min | max | mean | median | |
|---|---|---|---|---|---|
| segments | 208821 | 2 | 600 | 150.4 | 150 |
Files
| Filename | Size | md5 |
|---|---|---|
| ENCFF329IHN.bed.gz | 2.0 MB | 6bb6ed18e075ad1f2c660a003d2a86e1 |
| ENCFF329IHN.tabix.bed.gz | 1.72 MB | dce9b7435ff83f6c05114e05d4ab3d85 |
| ENCFF329IHN.tabix.bed.gz.tbi | 668.07 KB | 1c5665d9c5b787aececb16de6c029b48 |
| genomic_resource.yaml | 3.21 KB | e51cc4dd71050515dee32668c0d16879 |
| statistics/ |