Resource
| Id | DNase-seq/ENCSR014GTH |
|---|---|
| Type | position_score |
| Version | 0 |
| Summary | DNase-seq ENCSR014GTH [biosample_summary="Homo sapiens with Alzheimer''s disease; dorsolateral prefrontal cortex tissue female adult (81 years)"] |
| Description |
status: released biological_replicates: Rep 1 summary: female adult (81 years) with Alzheimer's disease output_type: peaks audit_warning: Signal Portion of Tags (SPOT) is a measure of enrichment, analogous to the commonly used fraction of reads in peaks metric. ENCODE processed alignment files {ENCFF535RWT|/files/ENCFF535RWT/} processed by DNase-seq ENCODE4 v3.0.0-alpha.2 GRCh38 pipeline ({ENCPL848KLD|/pipelines/ENCPL848KLD/}) for GRCh38 assembly have a SPOT1 score of 0.32. According to ENCODE standards, SPOT1 score of 0.4 or higher is considered a product of high quality data. Any sample with a SPOT1 score <0.3 should be targeted for replacement with a higher quality sample, and a SPOT1 score of 0.25 is considered minimally acceptable SPOT1 score of 0.25 is considered minimally acceptable for rare and hard to find primary tissues. (See {ENCODE DNase-seq data standards|/data-standards/dnase-seq-encode4/}) |
| Labels |
|
Scores (1)
| ID | Type | Default annotation | Description | Histogram | Range | Summary |
|---|---|---|---|---|---|---|
| DNase-seq_ENCSR014GTH | float |
DNase-seq_ENCSR014GTH |
DNase-seq ENCSR014GTH [biosample_summary="Homo sapiens with Alzheimer''s disease; dorsolateral prefrontal cortex tissue female adult (81 years)"]
|
 |
[0.0312, 17.6] |
|
n counts base pairs; sd is the population standard deviation.
Coverage
| Chromosome | Covered positions | Covered % | Segments |
|---|---|---|---|
| all chromosomes | 39067238 | 1.21% | 198303 |
| chr1 | 3348135 | 1.34% | 16927 |
| chr2 | 3785150 | 1.56% | 18872 |
| chr3 | 1966441 | 0.99% | 10039 |
| chr4 | 1027622 | 0.54% | 5346 |
| chr5 | 1871518 | 1.03% | 9578 |
| chr6 | 1597845 | 0.94% | 8395 |
| chr7 | 2162485 | 1.36% | 11043 |
| chr8 | 1711594 | 1.18% | 8708 |
| chr9 | 1722292 | 1.24% | 8722 |
| chr10 | 2520153 | 1.88% | 12590 |
| chr11 | 1927279 | 1.43% | 9640 |
| chr12 | 1560196 | 1.17% | 8068 |
| chr13 | 920634 | 0.81% | 4680 |
| chr14 | 1249764 | 1.17% | 6269 |
| chr15 | 1528547 | 1.50% | 7932 |
| chr16 | 1556794 | 1.72% | 7925 |
| chr17 | 2023036 | 2.43% | 10373 |
| chr18 | 931394 | 1.16% | 4766 |
| chr19 | 1448957 | 2.47% | 7315 |
| chr20 | 1341646 | 2.08% | 6765 |
| chr21 | 678048 | 1.45% | 3365 |
| chr22 | 1415643 | 2.79% | 6988 |
| chrX | 767565 | 0.49% | 3967 |
| chrY | 4500 | 0.01% | 30 |
| 3342 contigs with no values (129077085 bp) | 0 | 0.00% | 0 |
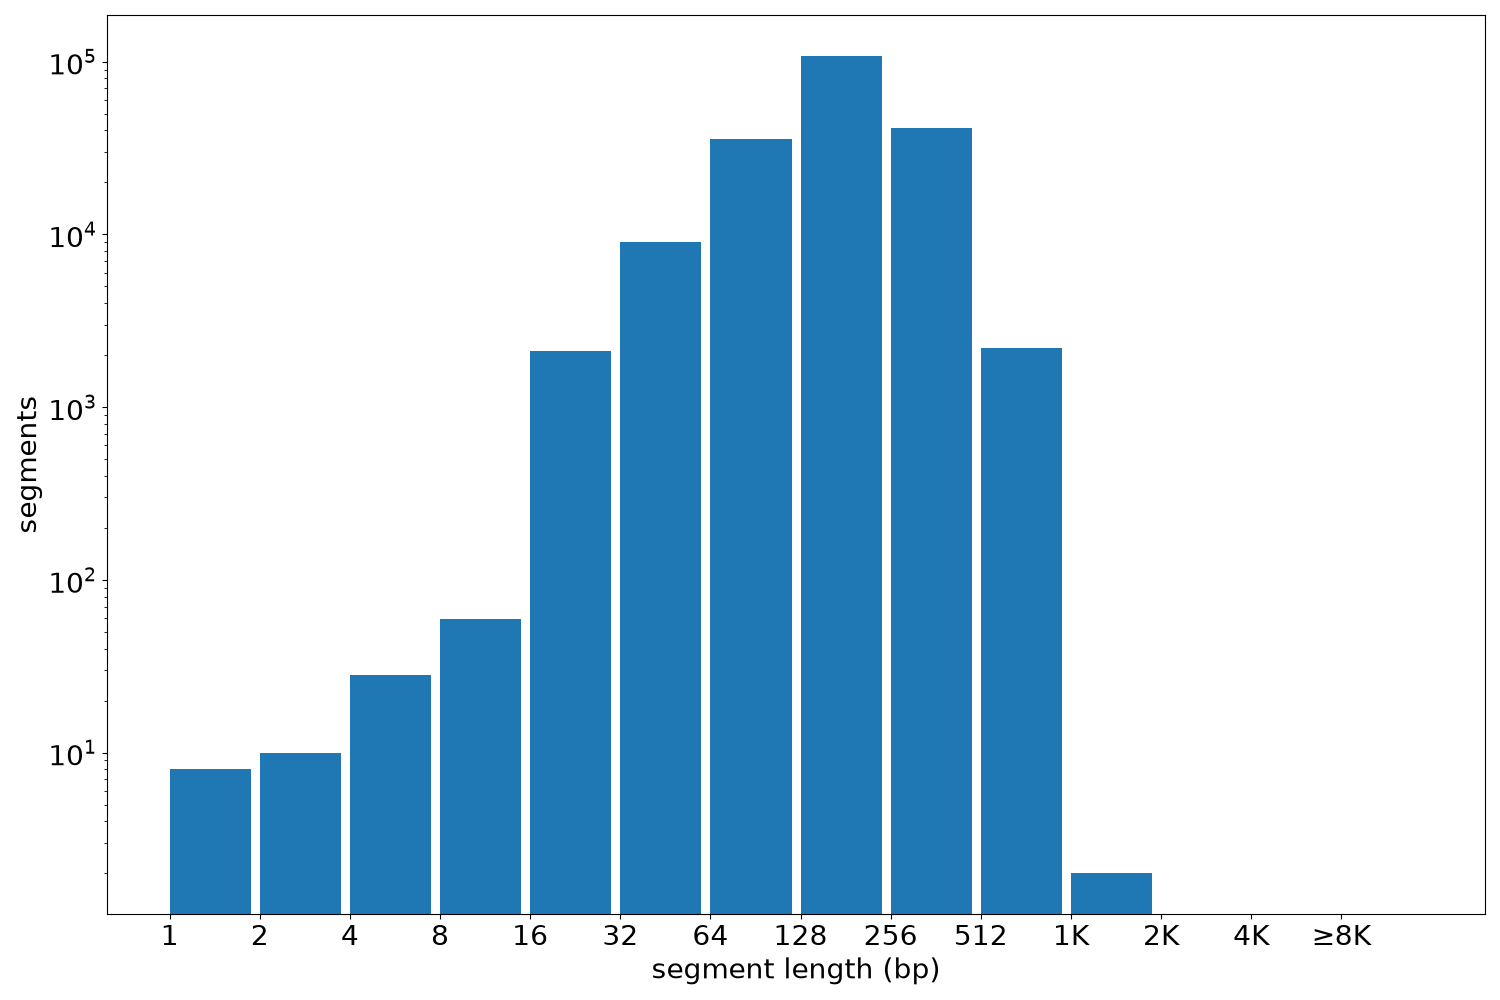
Segment lengths
| segments | min | max | mean | median | |
|---|---|---|---|---|---|
| segments | 198303 | 1 | 1260 | 197.01 | 180 |
Files
| Filename | Size | md5 |
|---|---|---|
| ENCFF891JQG.bed.gz | 1.92 MB | 04af6fbcd7d013ccdf47694f9ec4cf37 |
| ENCFF891JQG.tabix.bed.gz | 1.8 MB | 2cebe57168addaa6af08004d7083b5e9 |
| ENCFF891JQG.tabix.bed.gz.tbi | 337.13 KB | 32775db77fbfb54d9843dcf3715ef16c |
| genomic_resource.yaml | 2.23 KB | ebb824804d719b2e633212c081b716cd |
| statistics/ |