Resource
| Id | DNase-seq/ENCSR006MAW |
|---|---|
| Type | position_score |
| Version | 0 |
| Summary | DNase-seq ENCSR006MAW [biosample_summary="Homo sapiens dorsolateral prefrontal cortex tissue male adult (83 years)"] |
| Description |
status: released biological_replicates: Rep 1 summary: male adult (83 years) output_type: peaks audit_warning: Signal Portion of Tags (SPOT) is a measure of enrichment, analogous to the commonly used fraction of reads in peaks metric. ENCODE processed alignment files {ENCFF116NUQ|/files/ENCFF116NUQ/} processed by DNase-seq ENCODE4 v3.0.0 GRCh38 pipeline ({ENCPL848KLD|/pipelines/ENCPL848KLD/}) for GRCh38 assembly have a SPOT1 score of 0.33. According to ENCODE standards, SPOT1 score of 0.4 or higher is considered a product of high quality data. Any sample with a SPOT1 score <0.3 should be targeted for replacement with a higher quality sample, and a SPOT1 score of 0.25 is considered minimally acceptable SPOT1 score of 0.25 is considered minimally acceptable for rare and hard to find primary tissues. (See {ENCODE DNase-seq data standards|/data-standards/dnase-seq-encode4/}) |
| Labels |
|
Scores (1)
| ID | Type | Default annotation | Description | Histogram | Range | Summary |
|---|---|---|---|---|---|---|
| DNase-seq_ENCSR006MAW | float |
DNase-seq_ENCSR006MAW |
DNase-seq ENCSR006MAW [biosample_summary="Homo sapiens dorsolateral prefrontal cortex tissue male adult (83 years)"]
|
 |
[0.0553, 14.4] |
|
n counts base pairs; sd is the population standard deviation.
Coverage
| Chromosome | Covered positions | Covered % | Segments |
|---|---|---|---|
| all chromosomes | 16400350 | 0.51% | 85844 |
| chr1 | 1529318 | 0.61% | 8000 |
| chr2 | 1445442 | 0.60% | 7469 |
| chr3 | 933089 | 0.47% | 4884 |
| chr4 | 592229 | 0.31% | 3064 |
| chr5 | 862642 | 0.48% | 4584 |
| chr6 | 768752 | 0.45% | 4054 |
| chr7 | 802018 | 0.50% | 4246 |
| chr8 | 763342 | 0.53% | 3919 |
| chr9 | 711413 | 0.51% | 3755 |
| chr10 | 907048 | 0.68% | 4716 |
| chr11 | 890543 | 0.66% | 4686 |
| chr12 | 708775 | 0.53% | 3729 |
| chr13 | 316636 | 0.28% | 1651 |
| chr14 | 530181 | 0.50% | 2754 |
| chr15 | 601697 | 0.59% | 3159 |
| chr16 | 623500 | 0.69% | 3257 |
| chr17 | 784749 | 0.94% | 4119 |
| chr18 | 330169 | 0.41% | 1768 |
| chr19 | 716579 | 1.22% | 3634 |
| chr20 | 500421 | 0.78% | 2670 |
| chr21 | 226548 | 0.49% | 1176 |
| chr22 | 483259 | 0.95% | 2549 |
| chrX | 357127 | 0.23% | 1912 |
| chrY | 14873 | 0.03% | 89 |
| 3342 contigs with no values (129077085 bp) | 0 | 0.00% | 0 |
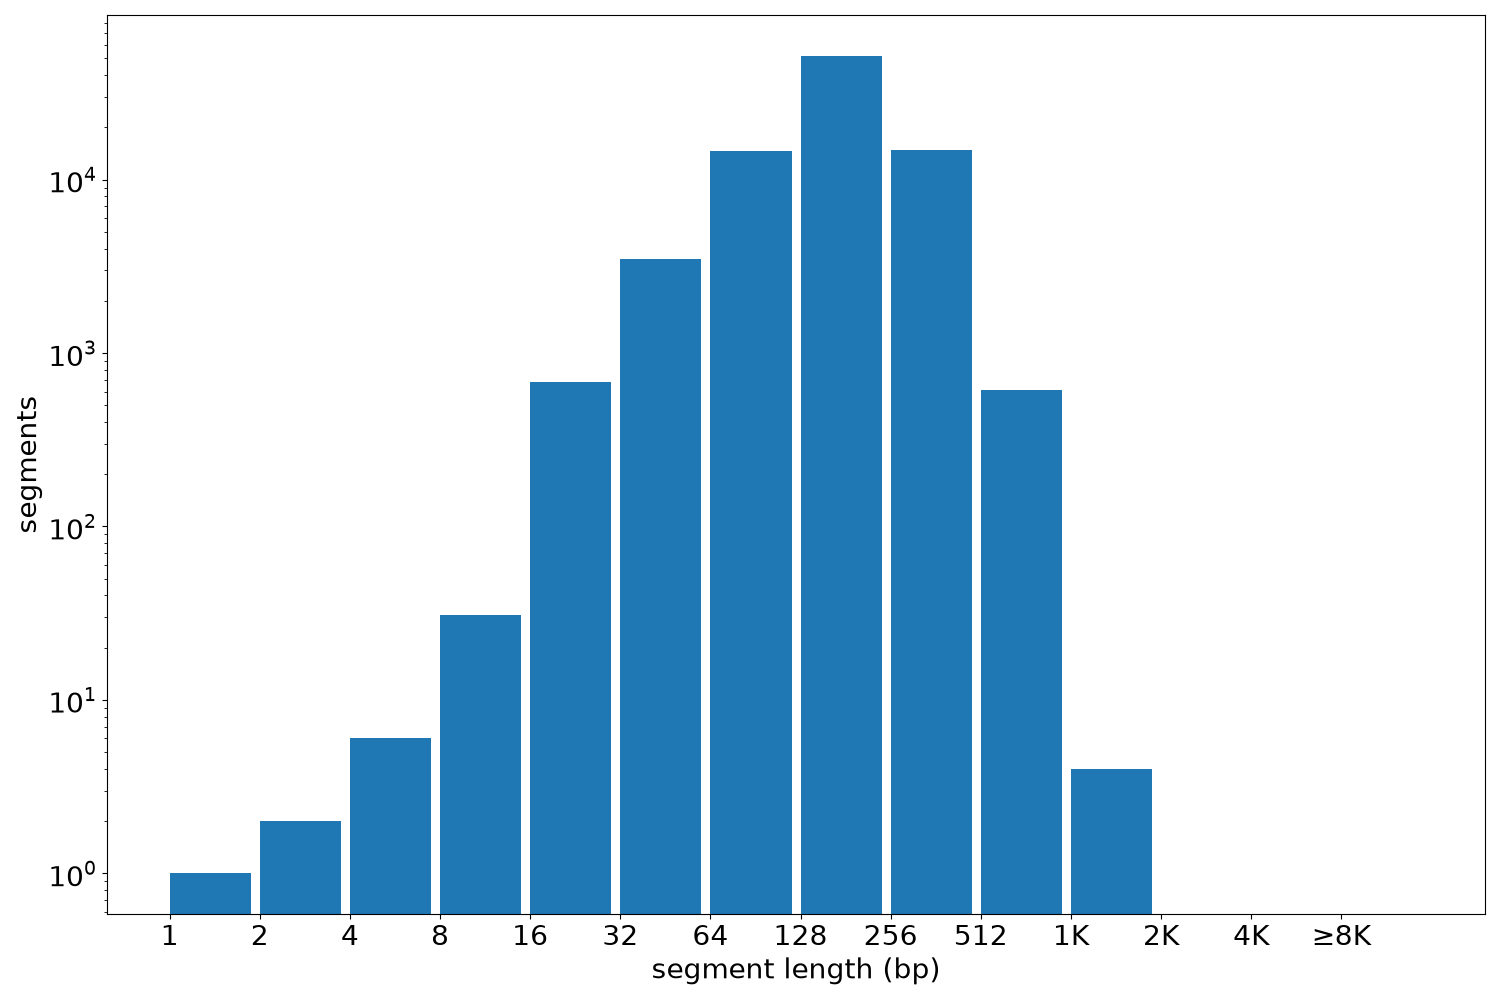
Segment lengths
| segments | min | max | mean | median | |
|---|---|---|---|---|---|
| segments | 85844 | 1 | 1180 | 191.05 | 180 |
Files
| Filename | Size | md5 |
|---|---|---|
| ENCFF620YIX.bed.gz | 920.58 KB | 845542ca2fbb2ed80e83291f94fe2a23 |
| ENCFF620YIX.tabix.bed.gz | 843.27 KB | fe35a3abb6947122b8dc92d7eb3f320f |
| ENCFF620YIX.tabix.bed.gz.tbi | 300.85 KB | d9ef50836b419a9c890ac24bf6e7ad3e |
| genomic_resource.yaml | 2.08 KB | 919bd6e91883bbec25e0850addb2a6d4 |
| statistics/ |