Resource
| Id | DNase-seq/ENCSR002IHL |
|---|---|
| Type | position_score |
| Version | 0 |
| Summary | DNase-seq ENCSR002IHL [biosample_summary="Homo sapiens head of caudate nucleus tissue male adult (83 years)"] |
| Description |
status: released biological_replicates: Rep 1 summary: male adult (83 years) output_type: peaks audit_warning: Signal Portion of Tags (SPOT) is a measure of enrichment, analogous to the commonly used fraction of reads in peaks metric. ENCODE processed alignment files {ENCFF582DHJ|/files/ENCFF582DHJ/} processed by DNase-seq ENCODE4 v3.0.0 GRCh38 pipeline ({ENCPL848KLD|/pipelines/ENCPL848KLD/}) for GRCh38 assembly have a SPOT1 score of 0.34. According to ENCODE standards, SPOT1 score of 0.4 or higher is considered a product of high quality data. Any sample with a SPOT1 score <0.3 should be targeted for replacement with a higher quality sample, and a SPOT1 score of 0.25 is considered minimally acceptable SPOT1 score of 0.25 is considered minimally acceptable for rare and hard to find primary tissues. (See {ENCODE DNase-seq data standards|/data-standards/dnase-seq-encode4/}) |
| Labels |
|
Scores (1)
| ID | Type | Default annotation | Description | Histogram | Range | Summary |
|---|---|---|---|---|---|---|
| DNase-seq_ENCSR002IHL | float |
DNase-seq_ENCSR002IHL |
DNase-seq ENCSR002IHL [biosample_summary="Homo sapiens head of caudate nucleus tissue male adult (83 years)"]
|
 |
[0.0367, 16.3] |
|
n counts base pairs; sd is the population standard deviation.
Coverage
| Chromosome | Covered positions | Covered % | Segments |
|---|---|---|---|
| all chromosomes | 46159714 | 1.43% | 240354 |
| chr1 | 4290830 | 1.72% | 22214 |
| chr2 | 3965015 | 1.64% | 20668 |
| chr3 | 2020638 | 1.02% | 10792 |
| chr4 | 1104091 | 0.58% | 5811 |
| chr5 | 2062462 | 1.14% | 10764 |
| chr6 | 1643035 | 0.96% | 8723 |
| chr7 | 2545360 | 1.60% | 13235 |
| chr8 | 1750442 | 1.21% | 9166 |
| chr9 | 1969183 | 1.42% | 10320 |
| chr10 | 2901685 | 2.17% | 15095 |
| chr11 | 2551525 | 1.89% | 13078 |
| chr12 | 1994372 | 1.50% | 10551 |
| chr13 | 795371 | 0.70% | 4318 |
| chr14 | 1565719 | 1.46% | 8065 |
| chr15 | 1859302 | 1.82% | 9725 |
| chr16 | 2223541 | 2.46% | 11570 |
| chr17 | 3040019 | 3.65% | 15791 |
| chr18 | 870329 | 1.08% | 4527 |
| chr19 | 1839279 | 3.14% | 9418 |
| chr20 | 1888186 | 2.93% | 9774 |
| chr21 | 829508 | 1.78% | 4267 |
| chr22 | 1965081 | 3.87% | 9913 |
| chrX | 473040 | 0.30% | 2497 |
| chrY | 11701 | 0.02% | 72 |
| 3342 contigs with no values (129077085 bp) | 0 | 0.00% | 0 |
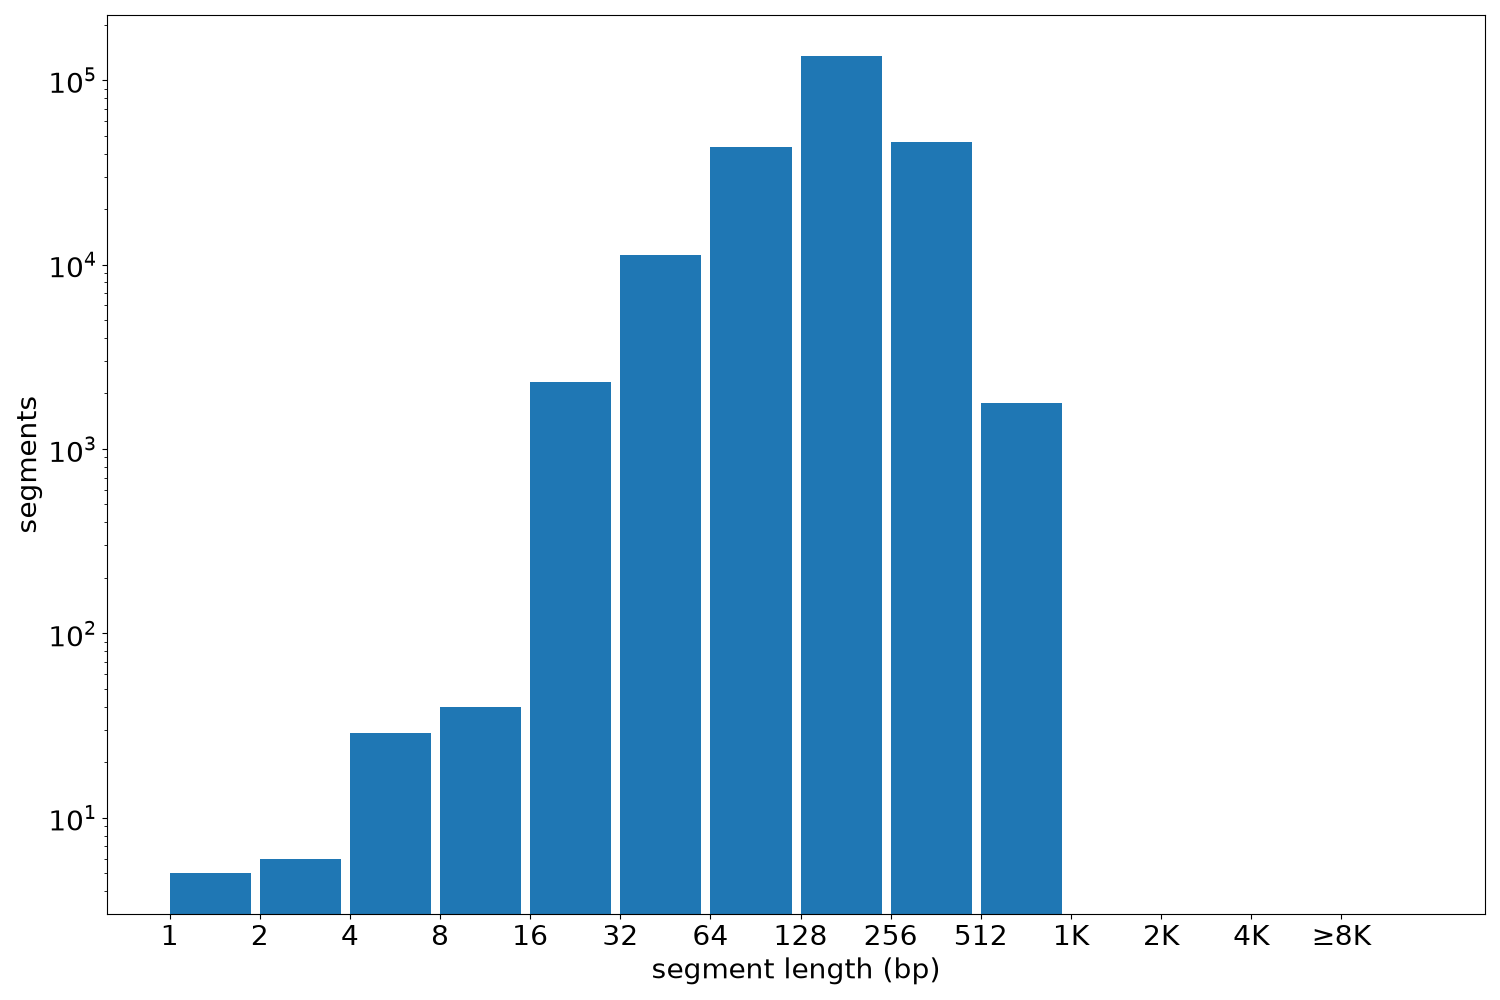
Segment lengths
| segments | min | max | mean | median | |
|---|---|---|---|---|---|
| segments | 240354 | 1 | 980 | 192.05 | 180 |
Files
| Filename | Size | md5 |
|---|---|---|
| ENCFF822HOO.bed.gz | 2.28 MB | 13ed13a15deac062ca8de99161972d96 |
| ENCFF822HOO.tabix.bed.gz | 2.12 MB | be30cf021d2ac4e3af7640dfb73147bb |
| ENCFF822HOO.tabix.bed.gz.tbi | 306.63 KB | bf6e368bf000bc06206e0f5cce9f1f66 |
| genomic_resource.yaml | 2.06 KB | 9d05ad72d931610afa9ddb3e3e5f5e36 |
| statistics/ |