Resource
| Id | DNase-seq/ENCSR000ENF |
|---|---|
| Type | position_score |
| Version | 0 |
| Summary | DNase-seq ENCSR000ENF [biosample_summary="Homo sapiens brain pericyte"] |
| Description |
status: released biological_replicates: Rep 1 summary: output_type: peaks audit_warning: Alignment file {ENCFF425VFT|/files/ENCFF425VFT/} processed by DNase-seq ENCODE4 v3.0.0-alpha.2 GRCh38 pipeline ( {ENCPL848KLD|/pipelines/ENCPL848KLD/} ) for GRCh38 assembly has 44115762 mapped reads. According to ENCODE standards, conventional DNase-seq profile requires a minimum of 20 million uniquely mapped reads to generate a reliable SPOT (Signal Portion of Tags) score. The recommended value is > 50 million. For deep, foot-printing depth DNase-seq 150-200 million uniquely mapped reads are recommended. (See {ENCODE DNase-seq data standards|/data-standards/dnase-seq-encode4/}) audit_warning: Signal Portion of Tags (SPOT) is a measure of enrichment, analogous to the commonly used fraction of reads in peaks metric. ENCODE processed alignment files {ENCFF425VFT|/files/ENCFF425VFT/} processed by DNase-seq ENCODE4 v3.0.0-alpha.2 GRCh38 pipeline ({ENCPL848KLD|/pipelines/ENCPL848KLD/}) for GRCh38 assembly have a SPOT1 score of 0.35. According to ENCODE standards, SPOT1 score of 0.4 or higher is considered a product of high quality data. Any sample with a SPOT1 score <0.3 should be targeted for replacement with a higher quality sample, and a SPOT1 score of 0.25 is considered minimally acceptable SPOT1 score of 0.25 is considered minimally acceptable for rare and hard to find primary tissues. (See {ENCODE DNase-seq data standards|/data-standards/dnase-seq-encode4/}) |
| Labels |
|
Scores (1)
| ID | Type | Default annotation | Description | Histogram | Range | Summary |
|---|---|---|---|---|---|---|
| DNase-seq_ENCSR000ENF | float |
DNase-seq_ENCSR000ENF |
DNase-seq ENCSR000ENF [biosample_summary="Homo sapiens brain pericyte"]
|
 |
[0.189, 42] |
|
n counts base pairs; sd is the population standard deviation.
Coverage
| Chromosome | Covered positions | Covered % | Segments |
|---|---|---|---|
| all chromosomes | 8837654 | 0.27% | 45220 |
| chr1 | 776267 | 0.31% | 3959 |
| chr2 | 717126 | 0.30% | 3712 |
| chr3 | 601514 | 0.30% | 3133 |
| chr4 | 463292 | 0.24% | 2407 |
| chr5 | 506051 | 0.28% | 2590 |
| chr6 | 586829 | 0.34% | 3012 |
| chr7 | 456085 | 0.29% | 2379 |
| chr8 | 399853 | 0.28% | 2034 |
| chr9 | 368542 | 0.27% | 1907 |
| chr10 | 414701 | 0.31% | 2124 |
| chr11 | 449177 | 0.33% | 2272 |
| chr12 | 444531 | 0.33% | 2248 |
| chr13 | 269260 | 0.24% | 1397 |
| chr14 | 262664 | 0.25% | 1320 |
| chr15 | 278775 | 0.27% | 1436 |
| chr16 | 271758 | 0.30% | 1367 |
| chr17 | 378249 | 0.45% | 1883 |
| chr18 | 181555 | 0.23% | 974 |
| chr19 | 337955 | 0.58% | 1604 |
| chr20 | 208814 | 0.32% | 1060 |
| chr21 | 104106 | 0.22% | 524 |
| chr22 | 148024 | 0.29% | 732 |
| chrX | 205679 | 0.13% | 1108 |
| chrY | 6847 | 0.01% | 38 |
| 3342 contigs with no values (129077085 bp) | 0 | 0.00% | 0 |
Segment lengths
| segments | min | max | mean | median | |
|---|---|---|---|---|---|
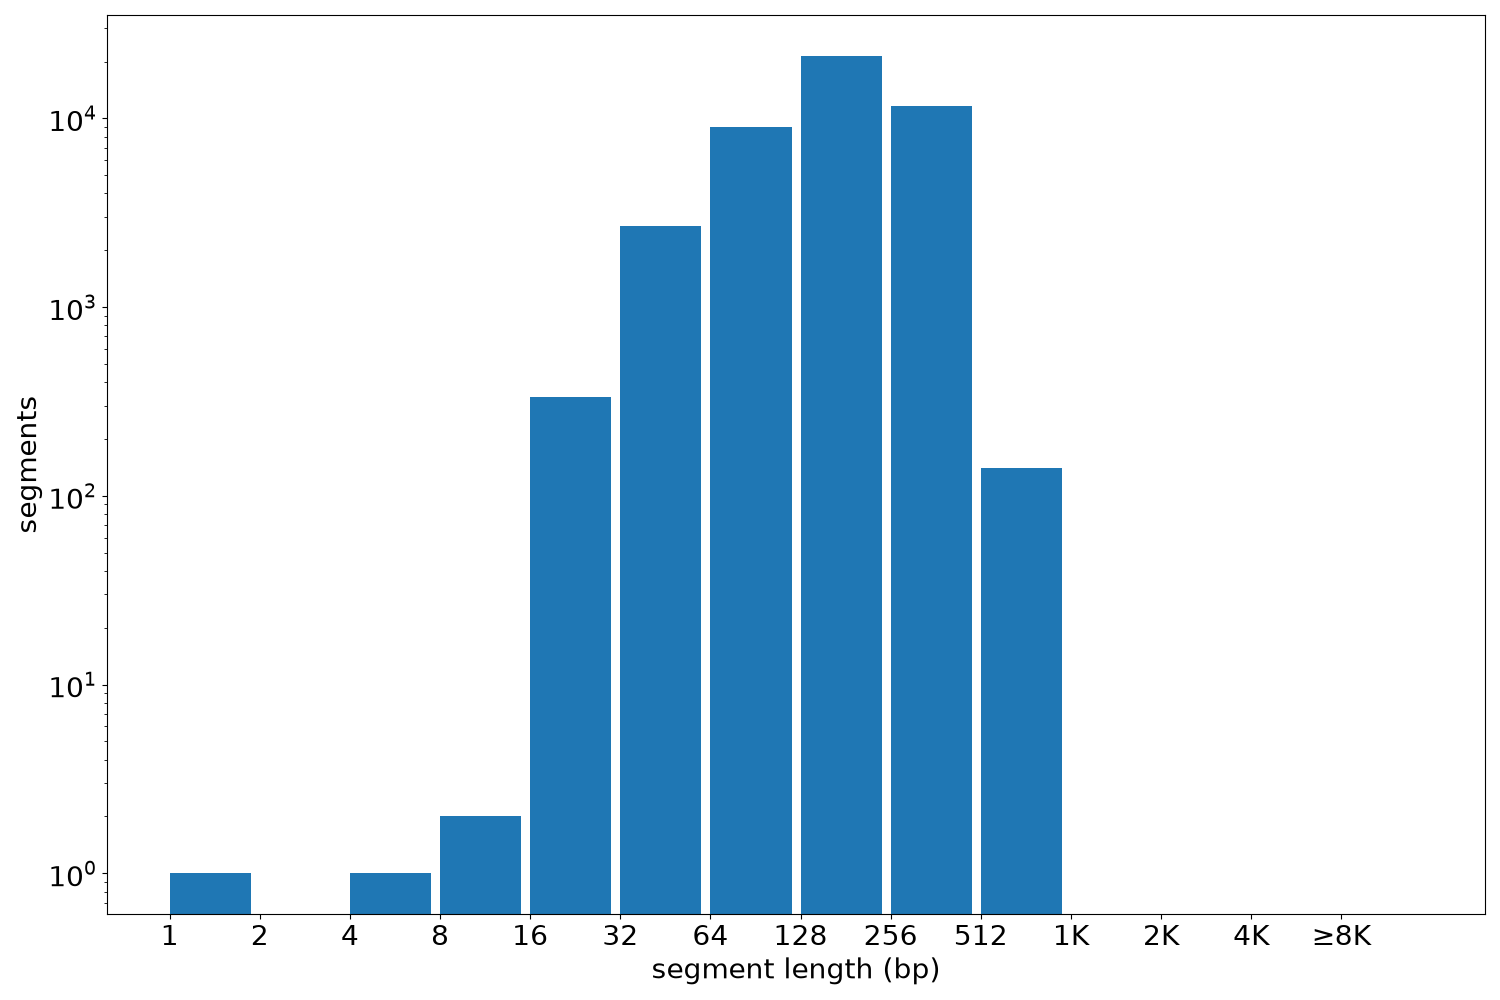
| segments | 45220 | 1 | 771 | 195.44 | 200 |
Files
| Filename | Size | md5 |
|---|---|---|
| ENCFF494ABI.bed.gz | 489.18 KB | 4f7b85de0a420002a75182e1ba30ce5e |
| ENCFF494ABI.tabix.bed.gz | 437.98 KB | 6cfc2720f66536c3836691b0f474aee6 |
| ENCFF494ABI.tabix.bed.gz.tbi | 270.91 KB | d4c87e243f1992c853372b32177d102e |
| genomic_resource.yaml | 2.58 KB | 0c776fda2824ad31039f867ad199d7cf |
| statistics/ |