Resource
| Id | DNase-seq/ENCSR000ELT |
|---|---|
| Type | position_score |
| Version | 0 |
| Summary | DNase-seq ENCSR000ELT [biosample_summary="Homo sapiens T47D"] |
| Description |
status: released biological_replicates: Rep 1 summary: output_type: peaks audit_internal_action: Released analysis {ENCAN523JUP|/analyses/ENCAN523JUP/} has in progress subobject document {506d8842-d136-4373-949d-f012142e41f3|/documents/506d8842-d136-4373-949d-f012142e41f3/} audit_warning: Signal Portion of Tags (SPOT) is a measure of enrichment, analogous to the commonly used fraction of reads in peaks metric. ENCODE processed alignment files {ENCFF003TSN|/files/ENCFF003TSN/} processed by DNase-seq ENCODE4 v3.0.0 GRCh38 pipeline ({ENCPL848KLD|/pipelines/ENCPL848KLD/}) for GRCh38 assembly have a SPOT1 score of 0.35. According to ENCODE standards, SPOT1 score of 0.4 or higher is considered a product of high quality data. Any sample with a SPOT1 score <0.3 should be targeted for replacement with a higher quality sample, and a SPOT1 score of 0.25 is considered minimally acceptable SPOT1 score of 0.25 is considered minimally acceptable for rare and hard to find primary tissues. (See {ENCODE DNase-seq data standards|/data-standards/dnase-seq-encode4/}) |
| Labels |
|
Scores (1)
| ID | Type | Default annotation | Description | Histogram | Range | Summary |
|---|---|---|---|---|---|---|
| DNase-seq_ENCSR000ELT | float |
DNase-seq_ENCSR000ELT |
DNase-seq ENCSR000ELT [biosample_summary="Homo sapiens T47D"]
|
 |
[0.0799, 25.7] |
|
n counts base pairs; sd is the population standard deviation.
Coverage
| Chromosome | Covered positions | Covered % | Segments |
|---|---|---|---|
| all chromosomes | 11262933 | 0.35% | 64223 |
| chr1 | 1067718 | 0.43% | 6089 |
| chr2 | 675715 | 0.28% | 4006 |
| chr3 | 746737 | 0.38% | 4253 |
| chr4 | 399473 | 0.21% | 2388 |
| chr5 | 606644 | 0.33% | 3445 |
| chr6 | 566188 | 0.33% | 3316 |
| chr7 | 550946 | 0.35% | 3148 |
| chr8 | 507616 | 0.35% | 2910 |
| chr9 | 503092 | 0.36% | 2842 |
| chr10 | 540522 | 0.40% | 3099 |
| chr11 | 686403 | 0.51% | 3869 |
| chr12 | 584094 | 0.44% | 3280 |
| chr13 | 215295 | 0.19% | 1270 |
| chr14 | 441772 | 0.41% | 2460 |
| chr15 | 383774 | 0.38% | 2206 |
| chr16 | 456663 | 0.51% | 2521 |
| chr17 | 659663 | 0.79% | 3634 |
| chr18 | 184336 | 0.23% | 1084 |
| chr19 | 536899 | 0.92% | 2913 |
| chr20 | 353320 | 0.55% | 1999 |
| chr21 | 134068 | 0.29% | 775 |
| chr22 | 212911 | 0.42% | 1215 |
| chrX | 249084 | 0.16% | 1501 |
| 3343 contigs with no values (186304500 bp) | 0 | 0.00% | 0 |
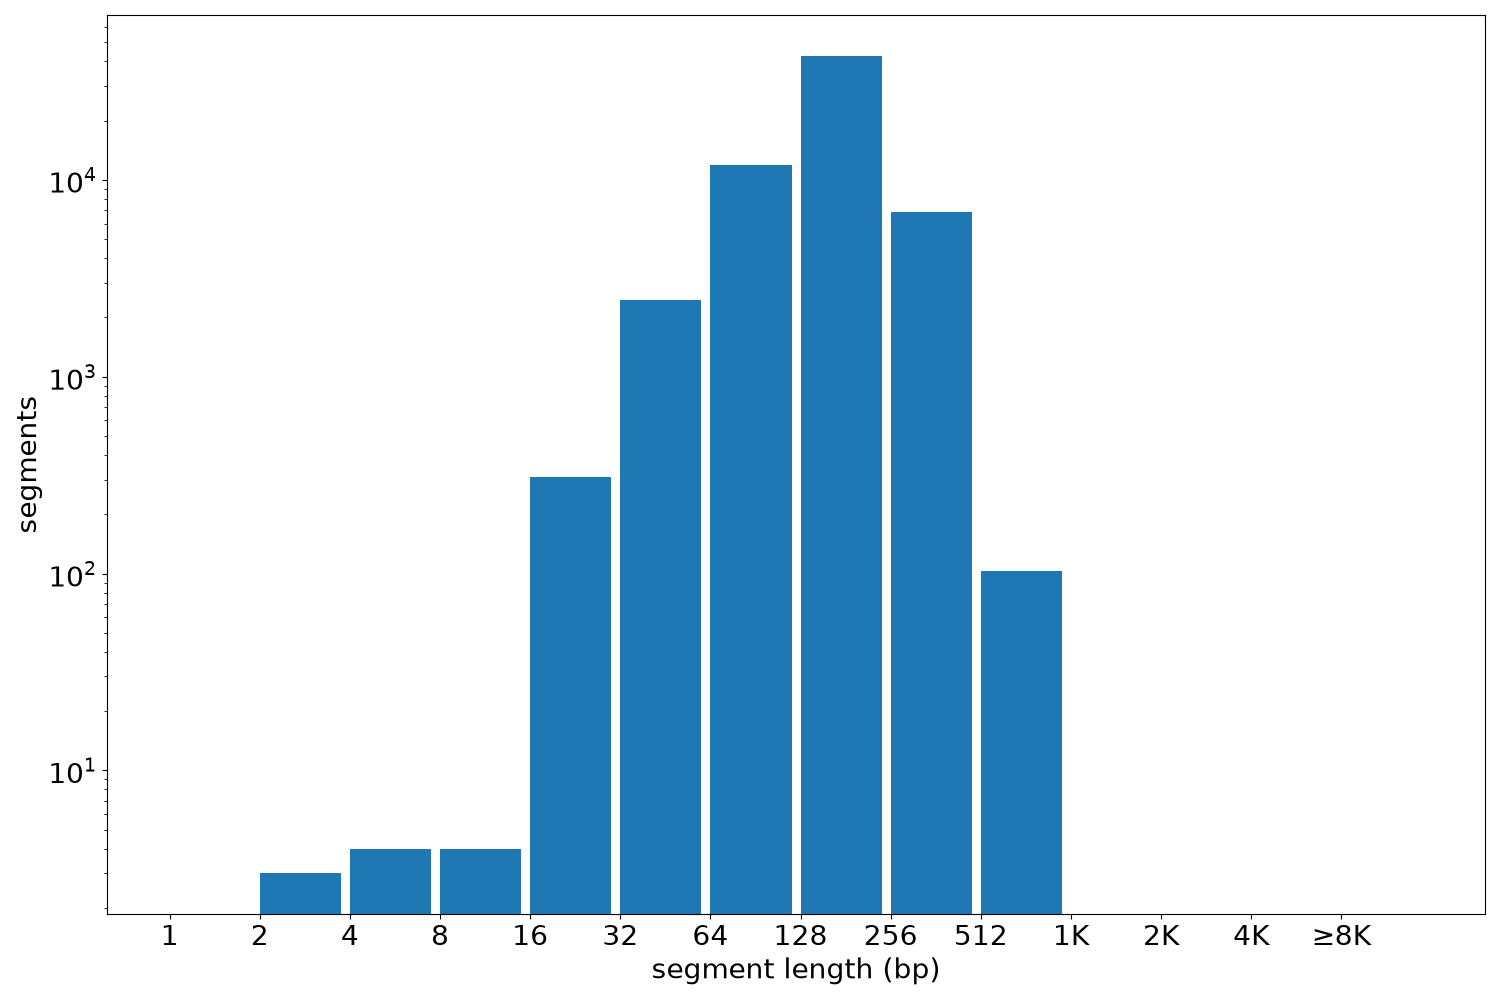
Segment lengths
| segments | min | max | mean | median | |
|---|---|---|---|---|---|
| segments | 64223 | 2 | 760 | 175.37 | 177 |
Files
| Filename | Size | md5 |
|---|---|---|
| ENCFF606YYY.bed.gz | 694.19 KB | 4bb58bf7bf7905a4ee47a2f6b11abb0c |
| ENCFF606YYY.tabix.bed.gz | 628.76 KB | e9ae6c4a596c8444af6d44ffa5cd36df |
| ENCFF606YYY.tabix.bed.gz.tbi | 307.84 KB | d5703caa8f474db290ed70e666d20c57 |
| genomic_resource.yaml | 2.12 KB | 5ac179d3e858f8c3aaaa47033e8c186e |
| statistics/ |