Resource
| Id | DNase-seq/ENCSR000ELD |
|---|---|
| Type | position_score |
| Version | 0 |
| Summary | DNase-seq ENCSR000ELD [biosample_summary="Homo sapiens epidermal melanocyte"] |
| Description |
status: released biological_replicates: Rep 1 summary: output_type: peaks audit_internal_action: Archived analysis {ENCAN614QQR|/analyses/ENCAN614QQR/} has in progress subobject quality standard {encode3-dnase|/quality-standards/encode3-dnase/} audit_warning: Signal Portion of Tags (SPOT) is a measure of enrichment, analogous to the commonly used fraction of reads in peaks metric. ENCODE processed alignment files {ENCFF208OOF|/files/ENCFF208OOF/} processed by DNase-seq ENCODE3 GRCh38 pipeline ({ENCPL001DNS|/pipelines/ENCPL001DNS/}) for GRCh38 assembly have a SPOT1 score of 0.38. According to ENCODE standards, SPOT1 score of 0.4 or higher is considered a product of high quality data. Any sample with a SPOT1 score <0.3 should be targeted for replacement with a higher quality sample, and a SPOT1 score of 0.25 is considered minimally acceptable SPOT1 score of 0.25 is considered minimally acceptable for rare and hard to find primary tissues. (See {ENCODE DNase-seq data standards|/data-standards/dnase-seq/}) |
| Labels |
|
Scores (1)
| ID | Type | Default annotation | Description | Histogram | Range | Summary |
|---|---|---|---|---|---|---|
| DNase-seq_ENCSR000ELD | float |
DNase-seq_ENCSR000ELD |
DNase-seq ENCSR000ELD [biosample_summary="Homo sapiens epidermal melanocyte"]
|
 |
[4, 2.14e+03] |
|
n counts base pairs; sd is the population standard deviation.
Coverage
| Chromosome | Covered positions | Covered % | Segments |
|---|---|---|---|
| all chromosomes | 24903769 | 0.77% | 165733 |
| chr1 | 2249992 | 0.90% | 14970 |
| chr2 | 1774307 | 0.73% | 11792 |
| chr3 | 1376544 | 0.69% | 9164 |
| chr4 | 1103409 | 0.58% | 7347 |
| chr5 | 1199089 | 0.66% | 7981 |
| chr6 | 1327395 | 0.78% | 8836 |
| chr7 | 1198180 | 0.75% | 7965 |
| chr8 | 972399 | 0.67% | 6472 |
| chr9 | 1214684 | 0.88% | 8093 |
| chr10 | 1138093 | 0.85% | 7568 |
| chr11 | 1346819 | 1.00% | 8966 |
| chr12 | 1154349 | 0.87% | 7687 |
| chr13 | 565162 | 0.49% | 3765 |
| chr14 | 749649 | 0.70% | 4990 |
| chr15 | 674109 | 0.66% | 4493 |
| chr16 | 1057149 | 1.17% | 7037 |
| chr17 | 1572264 | 1.89% | 10458 |
| chr18 | 445972 | 0.55% | 2965 |
| chr19 | 1360555 | 2.32% | 9060 |
| chr20 | 718408 | 1.11% | 4782 |
| chr21 | 308595 | 0.66% | 2055 |
| chr22 | 622810 | 1.23% | 4144 |
| chrX | 714622 | 0.46% | 4748 |
| chrY | 59214 | 0.10% | 395 |
| 3342 contigs with no values (129077085 bp) | 0 | 0.00% | 0 |
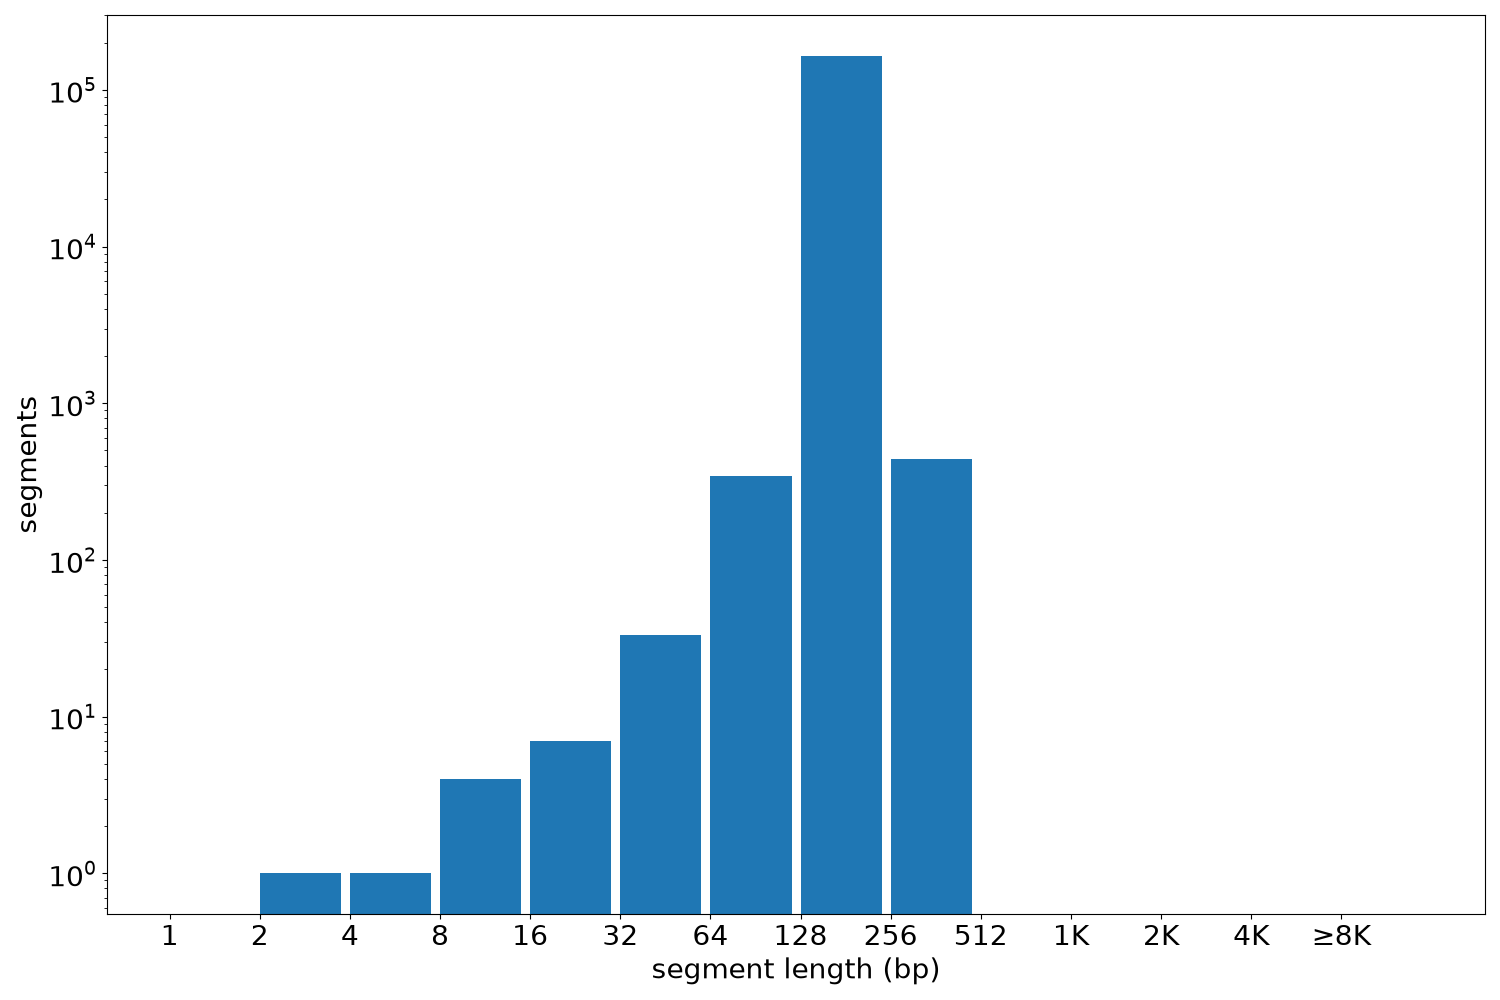
Segment lengths
| segments | min | max | mean | median | |
|---|---|---|---|---|---|
| segments | 165733 | 2 | 450 | 150.26 | 150 |
Files
| Filename | Size | md5 |
|---|---|---|
| ENCFF075MQY.bed.gz | 1.58 MB | ef38b0bf27cdd66463ffe0c33dff1b01 |
| ENCFF075MQY.tabix.bed.gz | 1.34 MB | 5197e585a70488ae0e12e859e044ad52 |
| ENCFF075MQY.tabix.bed.gz.tbi | 522.88 KB | f22986fa421390fbf7b9d53ffeef248a |
| genomic_resource.yaml | 2.13 KB | 3e291451ec6cb684847953c9932ee0fa |
| statistics/ |